


Listen to the article
Market analysts say Ether’s (ETH) price may drop to $1,000 if a breakdown from a bearish chart pattern is confirmed.
Key takeaways:
- Ether’s bear flag targets 50% ETH price drop to $1,075.
- Ether risks over $1.70 billion in long liquidations if the price breaks below $2,000.
- Whale accumulation weakens as major ETH holders reduce exposure.
Ether’s bear flag targets $1,000 ETH price
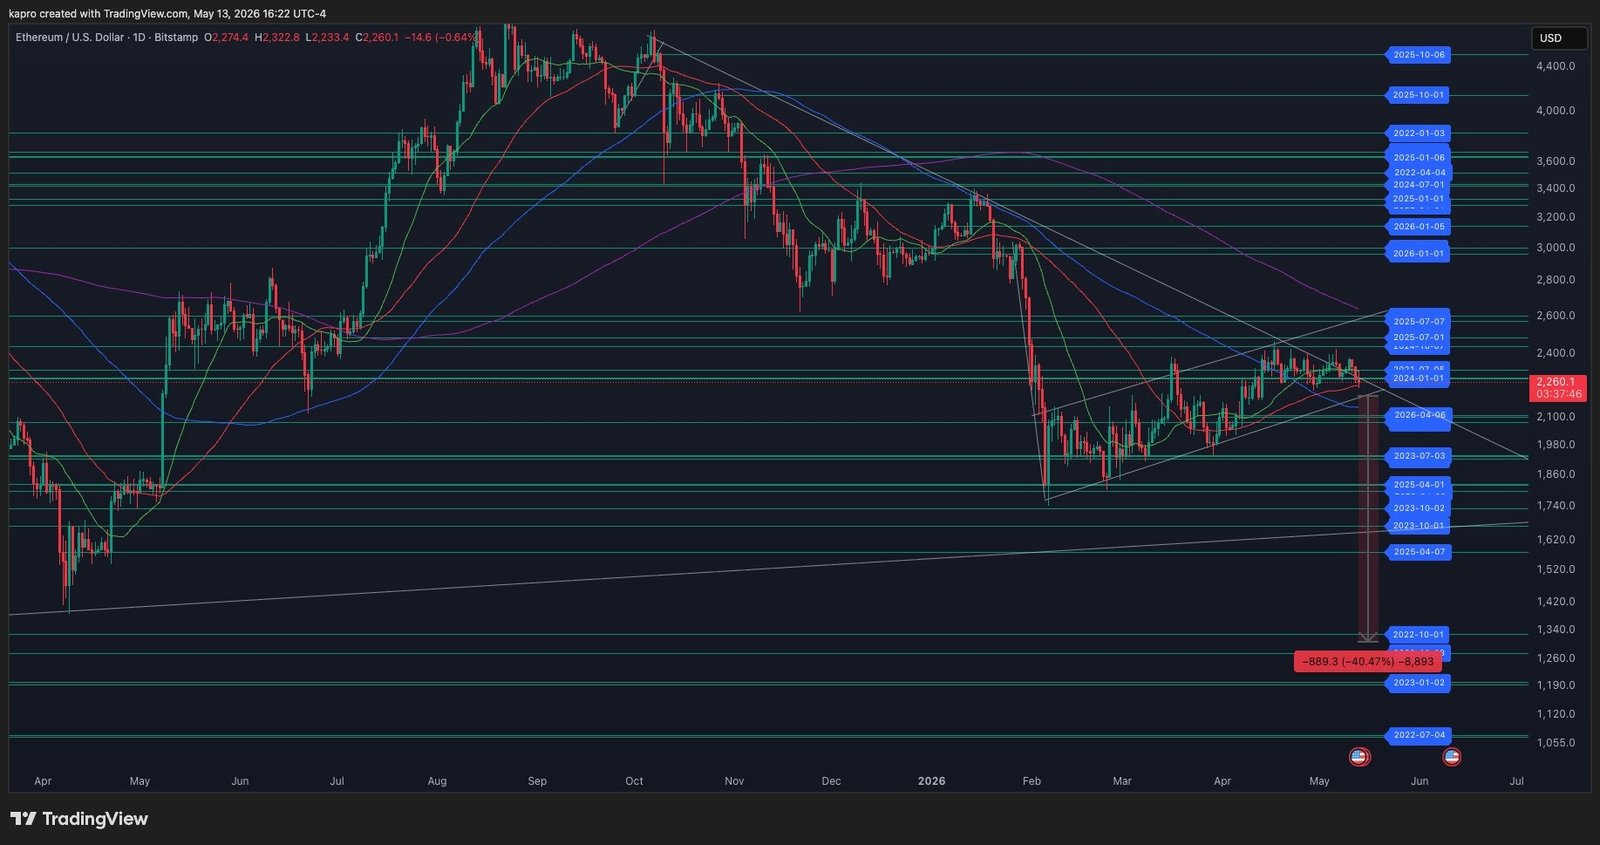
Ether’s downtrend could accelerate if the price breaks below the lower trend line of a bear flag at $2,000 on the daily chart, where a similar breakdown in January led to a 41.5% ETH price drop.
Related: Ether taker volume turns negative for first time in two months: Will ETH fall under $2K next?
A bear flag pattern is a bearish continuation setup that forms after the price consolidates inside an up-sloping channel following a sharp price drop.
The measured target of the flag, derived from the previous downtrend’s height added to the breakdown point at $2,000, is $1,075, down 49% from the current price.
ETH/USD weekly chart. Source: Cointelegraph/TradingView
“$ETH is about to break the bear flag pattern,” analyst Coin Signals said in a Monday post on X, adding that if the price fails to hold above the lower trend line at 2,000, a “sell-off to $1800 or a new low” would follow.
Fellow analyst Keith Alan told his followers to be “prepared for the nasty scenario,” involving the confirmation of a death cross between the 21-day simple moving average (SMA) and 50-day SMA, and validation of a bear flag in the daily time frame.
“Momentum indicators also show deterioration on both daily and weekly RSI timeframes,” the analyst said in a recent article on X.
“Failure to establish support, however, opens the door to a sequence of progressively lower technical support levels” toward the measured target of the bear flag structure around $1,300, he added.
ETH/USD daily chart. Source: X/Keith Alan
Fellow analyst Crypto Patel said that ETH’s validation of a rising wedge pattern was underway, with a downside target of $1,500.
“Ethereum has lost a key rising trendline. As long as the price stays below it, weakness can continue.”
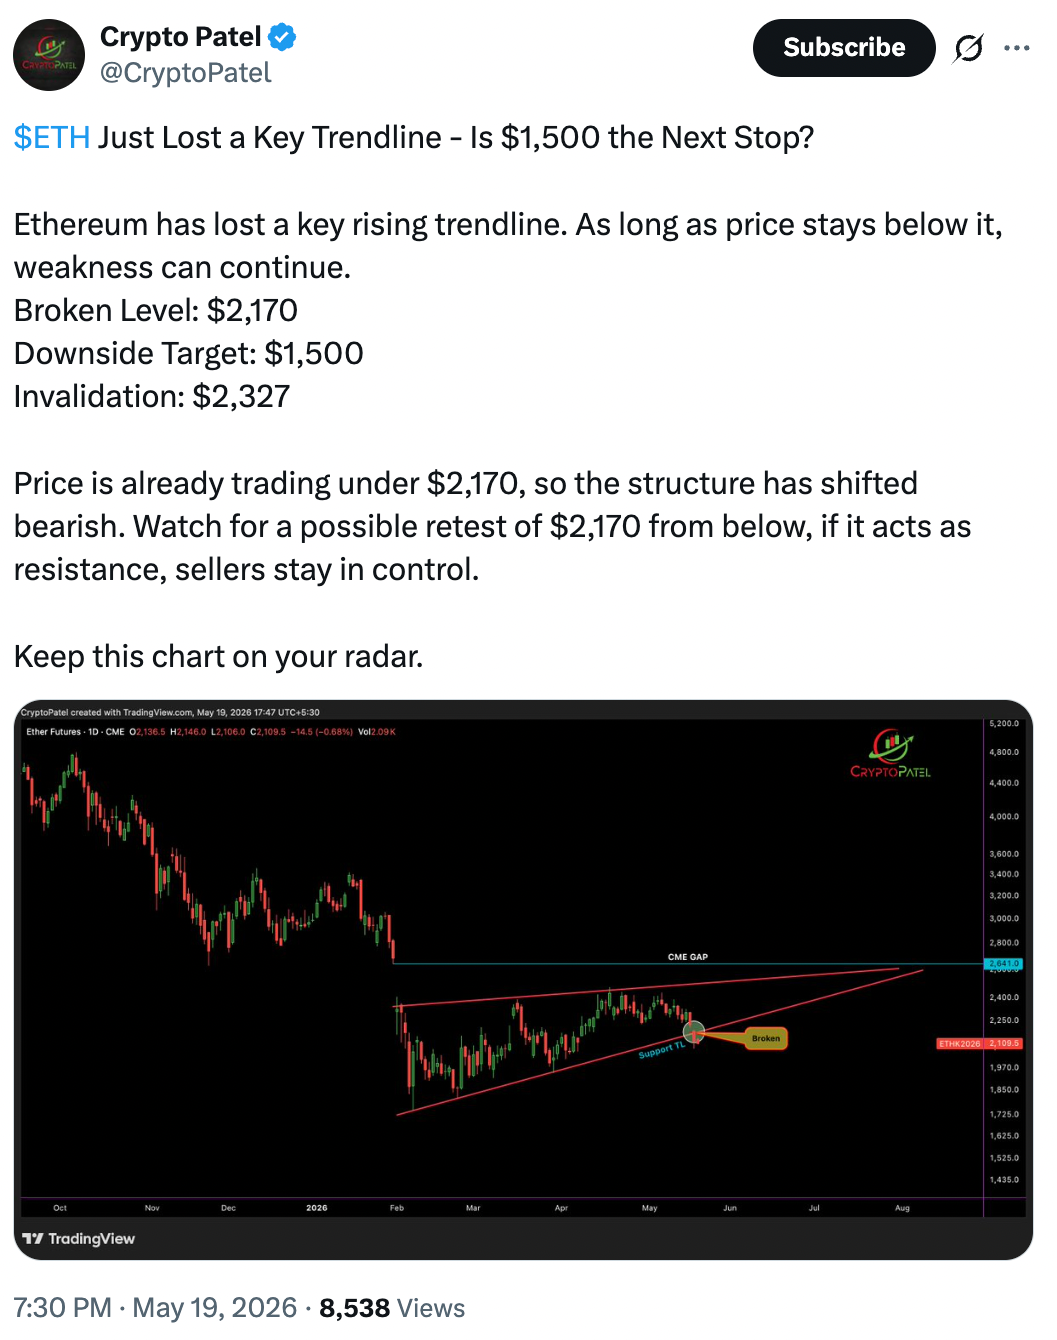
ETH/USD daily chart. Source: X/Crypto Patel
Meanwhile, Ethereum’s liquidation map shows that a correction below $2,000 would trigger over $1.70 billion worth of leveraged long ETH liquidations across all exchanges, according to CoinGlass data.
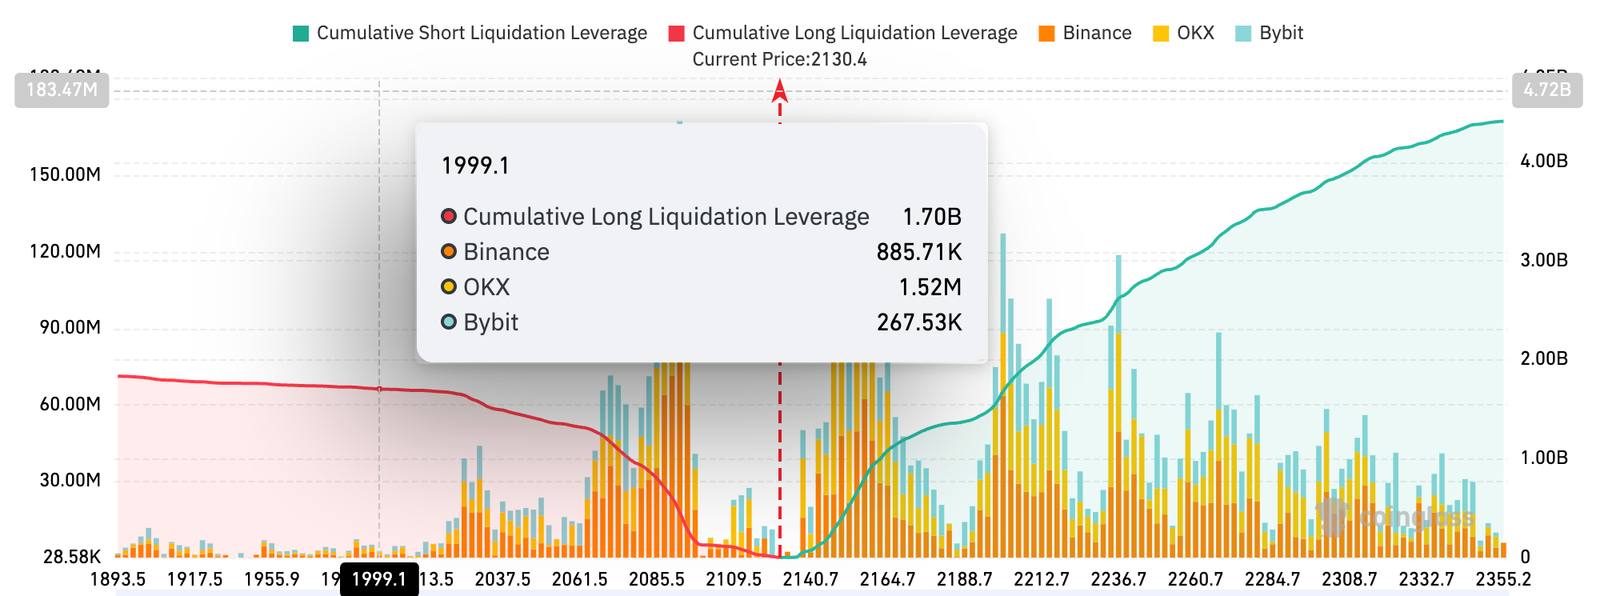
ETH exchange liquidation map. Source: CoinGlass
Ethereum whale accumulation drops
Ether’s latest rebound to $2,400 did not trigger broad-based accumulation across major wallet cohorts, Glassnode data showed.
For instance, the number of mega-whale wallets holding more than 10,000 ETH has declined sharply to a 10-month low of 1,050, with the 30-day change dropping to as low as -70, levels last seen in early February.
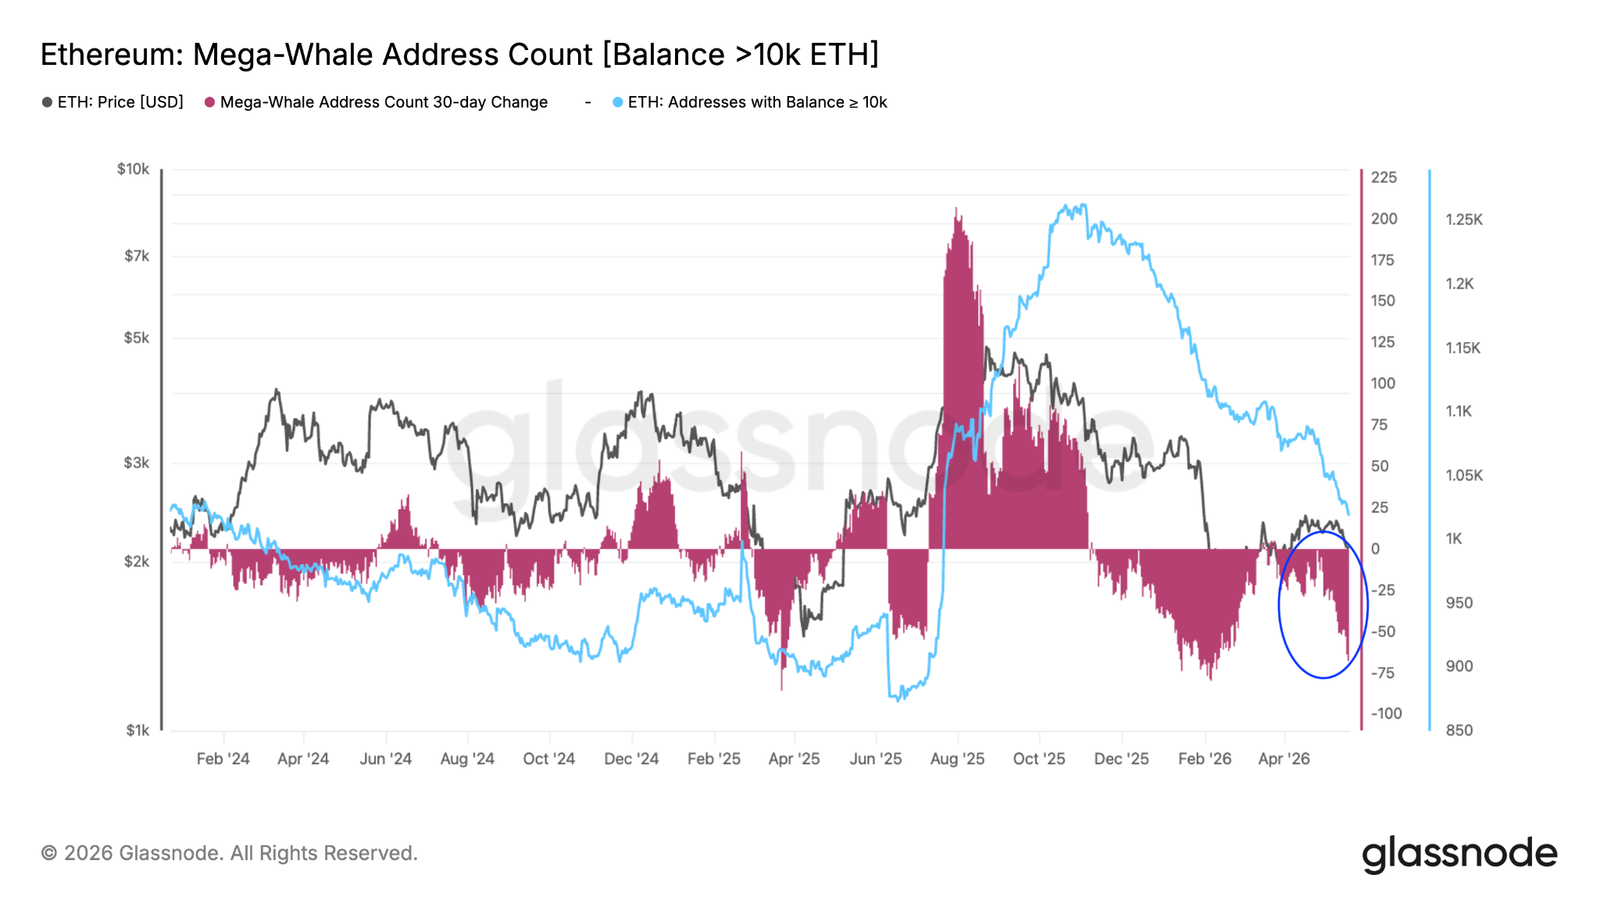
Ethereum mega-whale address count balance (>10K ETH). Source: Glassnode
In other words, large players are taking advantage of recent liquidity to de-risk, reflecting a lack of mid-term confidence.
The picture looks similar among smaller wallet cohorts.
Ethereum wallets holding 1,000 to 10,000 ETH have also been declining, falling to a nine-month low of 4,750 on May 8. The 30-day change remains negative, hovering around -50 at the time of writing.
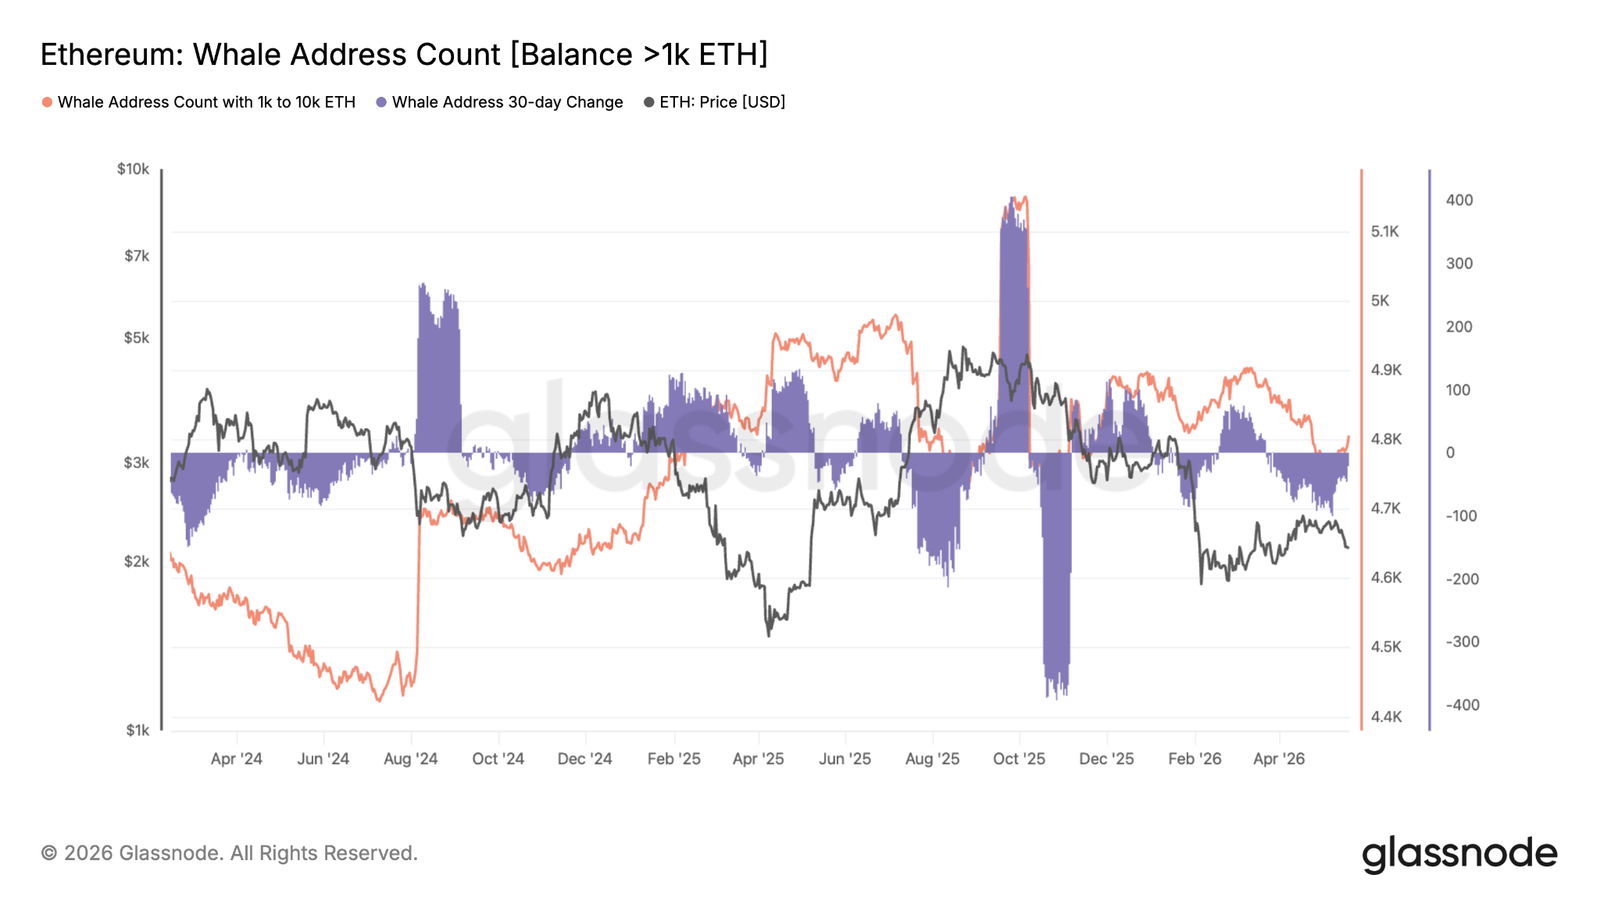
Ethereum whale and shark address count balance. Source: Glassnode
Taken together, the data suggest ongoing distribution and weak conviction across key ETH holder cohorts, reinforcing the risk of a deeper drop if $2,000 breaks.
This reduction in whale counts aligns with the recent inflows into exchanges, indicating the path of least resistance remains down in the immediate future and selling pressure mounts.
Read the full article here
Fact Checker
Verify the accuracy of this article using AI-powered analysis and real-time sources.