


Listen to the article
Bitcoin (BTC) heads into June with new local lows as the US-Iran war drives crypto market nerves.
- Iran ceasefire hopes hang in the balance as military strikes return, but US President Donald Trump appears confident that “it will all work out well in the end.”
- BTC price weakness quickly returns after the May close, with $72,000 liquidity on the radar.
- US employment data could still deliver a classic BTC price tailwind.
- Bitcoin long-term holders are putting February’s $60,000 lows in doubt as a reliable floor.
- Sentiment research calls for a flush of overly optimistic traders’ positions next.
Trump on Iran: “Just sit back and relax”
News of strikes on Iranian targets keep the Middle East conflict firmly on the radar as a source of crypto market volatility this week.
Exchanges of fire meant that BTC price action quickly came under pressure following the monthly close, dropping below $73,000.
BTC/USD one-day chart. Source: Cointelegraph/TradingView
The latest events further brought into question the odds of a ceasefire being signed, with this notionally meant to last at least 60 days.
“Iran really wants to make a deal, and it will be a good one for the U.S.A. and those that are with us,” US president Donald Trump wrote in a post on Truth Social on Monday.
Trump referenced hurdles in the form of political dissent at home — rather than specific problems involving Iran itself — as the reason for the lack of progress.
He concluded:
“Just sit back and relax, it will all work out well in the end – It always does!”
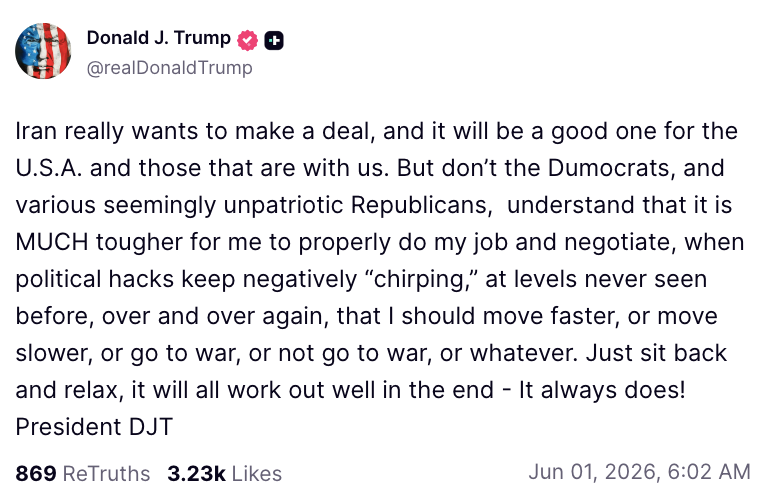
Source: Truth Social
Despite Bitcoin feeling the heat, US stocks looked set to continue a trend of divergence with crypto as the new week began. S&P 500 futures opened the week up by around 0.25%.
Commenting on the factors driving the equities rally, which last week saw repeat new all-time highs, trading resource Mosaic Asset Company put AI firmly in focus.
“The narrative driving the stock market has hardly changed in recent weeks,” it wrote in the latest edition of its regular analysis series, Mosaic Chart Alerts.
“Optimism around a potential peace deal between the U.S. and Iran helps to spark a rally in the major indexes. For the most part, there has been very little substance behind the headlines, but that hasn’t stopped the rally in stocks linked to the AI infrastructure buildout.”
Bitcoin price caught between liquidity and CME gap
Bitcoin started the first week of June with a bump as US-Iran war tensions quickly spilled over into BTC price action.
Data from TradingView shows a trip below $73,000 just hours after the weekly and monthly candle close.
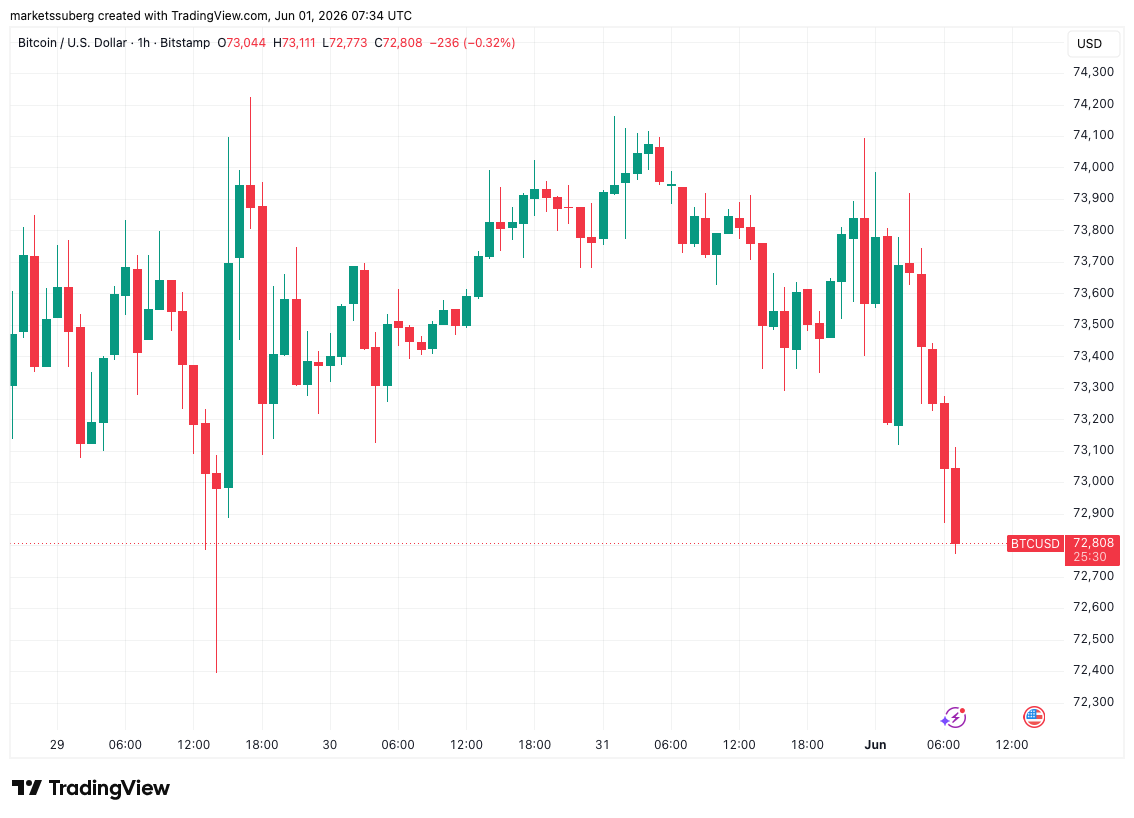
BTC/USD one-hour chart. Source: Cointelegraph/TradingView
“For now price is stuck within this mini-range since last week,” trader Daan Crypto Trades summarized in his latest analysis on X.
“~$74.2K keeps rejecting price as resistance while ~$72.7K is held as support. Those are the levels to watch in the short term.”
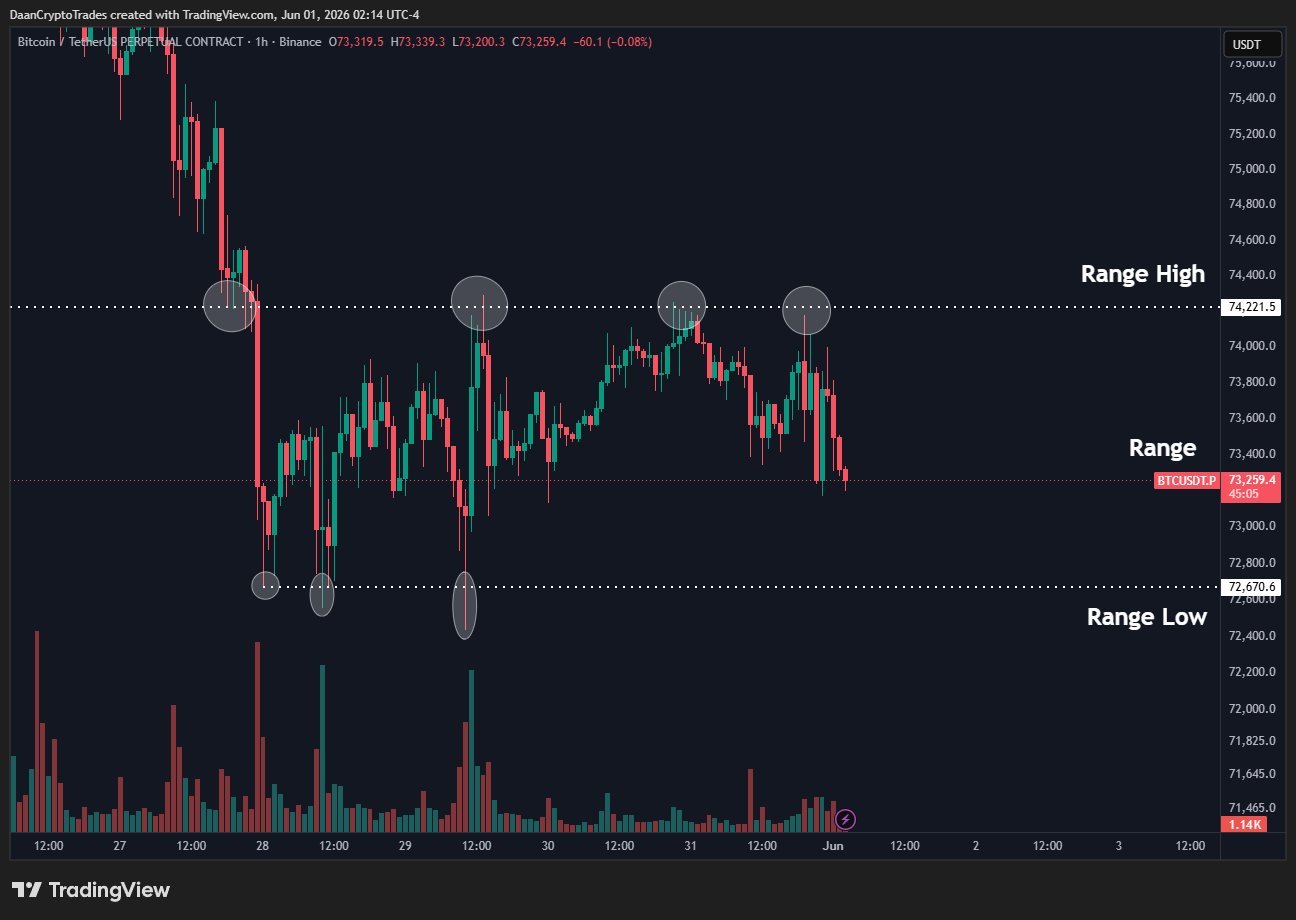
BTC/USDT perpetual contract one-hour chart. Source: Daan Crypto Trades/X
Trader CW suggested that the price was targeting nearby high-liquidity levels on exchange order books, notably a position closer to $72,000.
“The buy wall for $BTC whales is at 72k and the sell wall is at 80k,” they added.
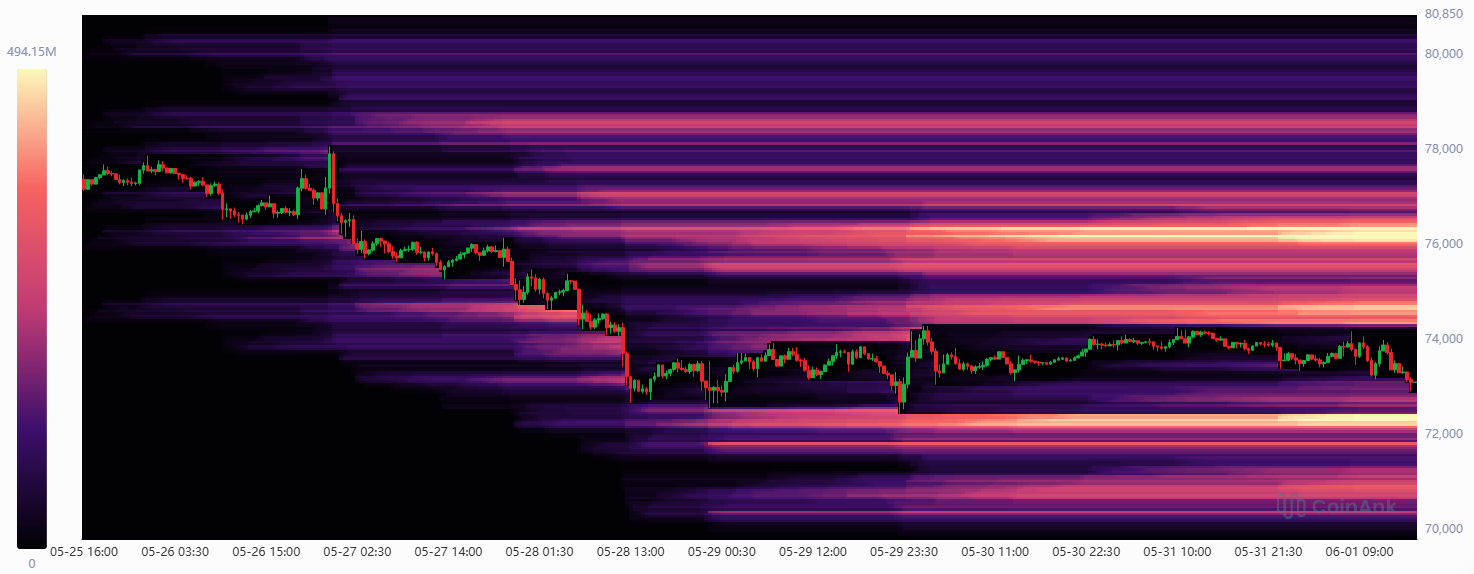
BTC order-book liquidation heatmap. Source: CW/X
A silver lining came from the weekly close itself, which preserved what trader and analyst Rekt Capital said would be a key level for bulls — $73,000.
“If Bitcoin manages to Weekly Close above $73k then price will be one step closer to confirming the Double Bottom breakout & be positioned to try to trend continue,” he told X followers at the weekend.
To the upside, trader CrypNuevo flagged a lone CME Group’s Bitcoin futures near $75,000 as a potential short-term BTC price target.
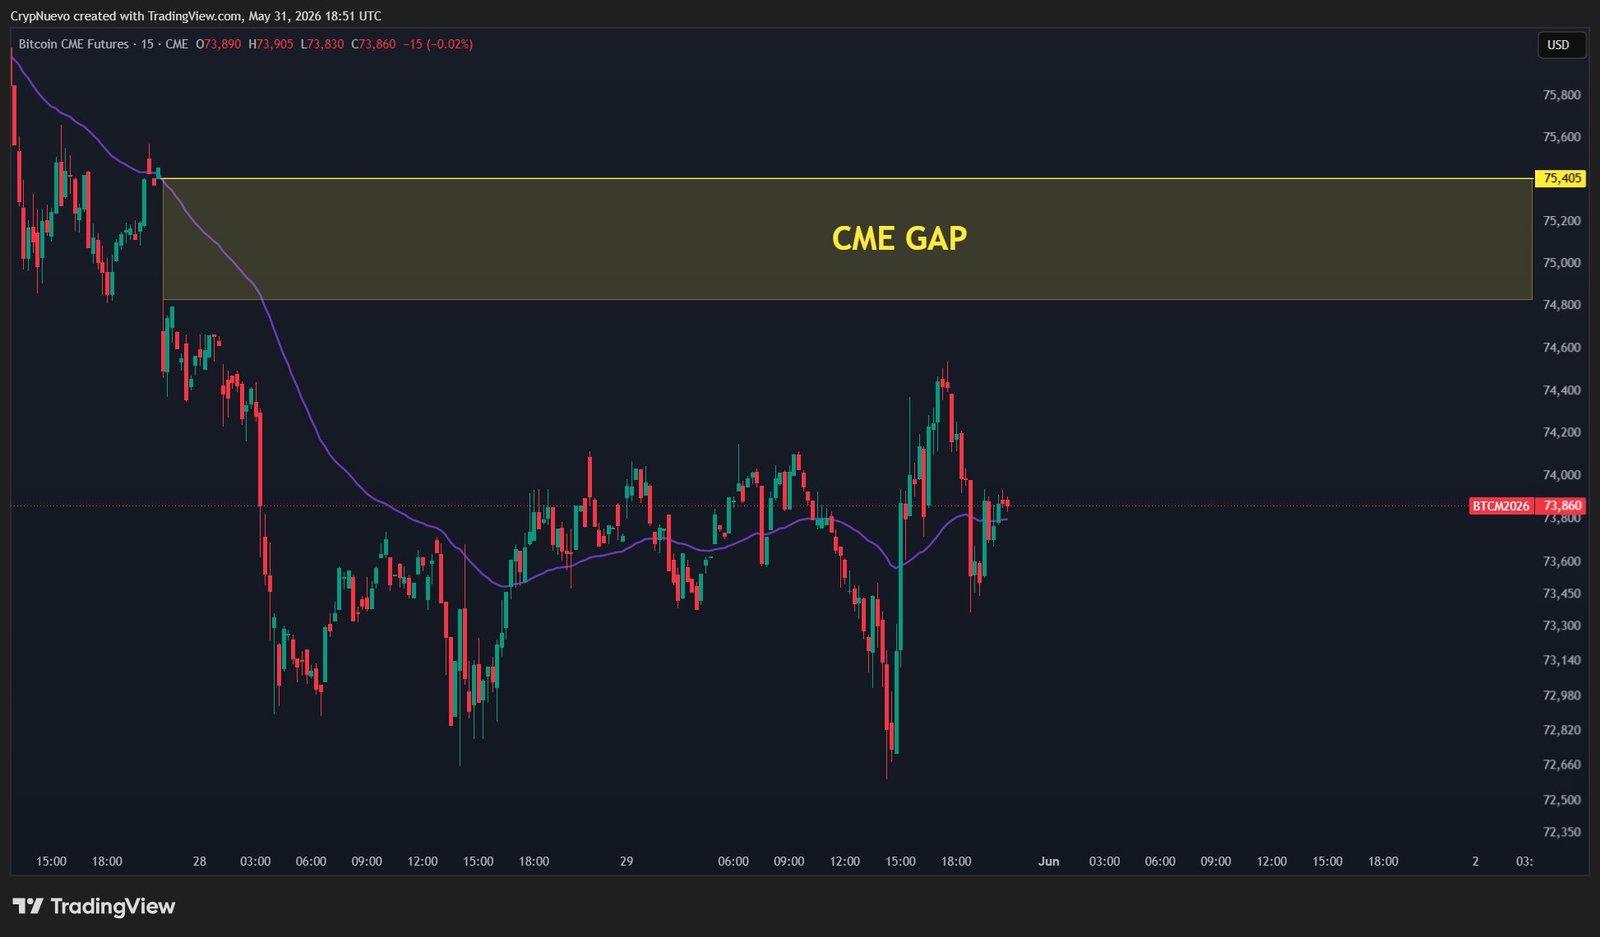
CME Bitcoin futures 15-minute chart. Source: CrypNuevo/X
As Cointelegraph reported, CME gaps became a thing of the past last week as its futures market started to trade 24 hours a day, seven days a week.
CrypNuevo said that they were looking for a “W”-shaped reversal pattern for price on low time frames.
PMI leads potential BTC price boost sources
The coming week sees inflation data yield to employment cues as the labor market becomes traders’ key focus.
Monday starts with the May print of the Institute for Supply Management (ISM) Manufacturing Purchasing Managers’ Index (PMI) — one of two core PMI releases this week.
ISM has been in a fresh uptrend since earlier in the year, when it ended a three-year period of contraction and immediately delivered a tailwind to Bitcoin price performance.
Commenting, entrepreneur and investor Mark Chadwick had some good news for crypto bulls. Based on business cycles, recent PMI figures could preclude a new period of gains.
“Expansion zones perfectly align with previous Alt Seasons – and we’re about to expand! The data backs it up too: ISM PMI has been above 50 for 3 straight months. Above 50 = expansion,” he wrote in an X post alongside data from pseudonymous analyst TechDev.
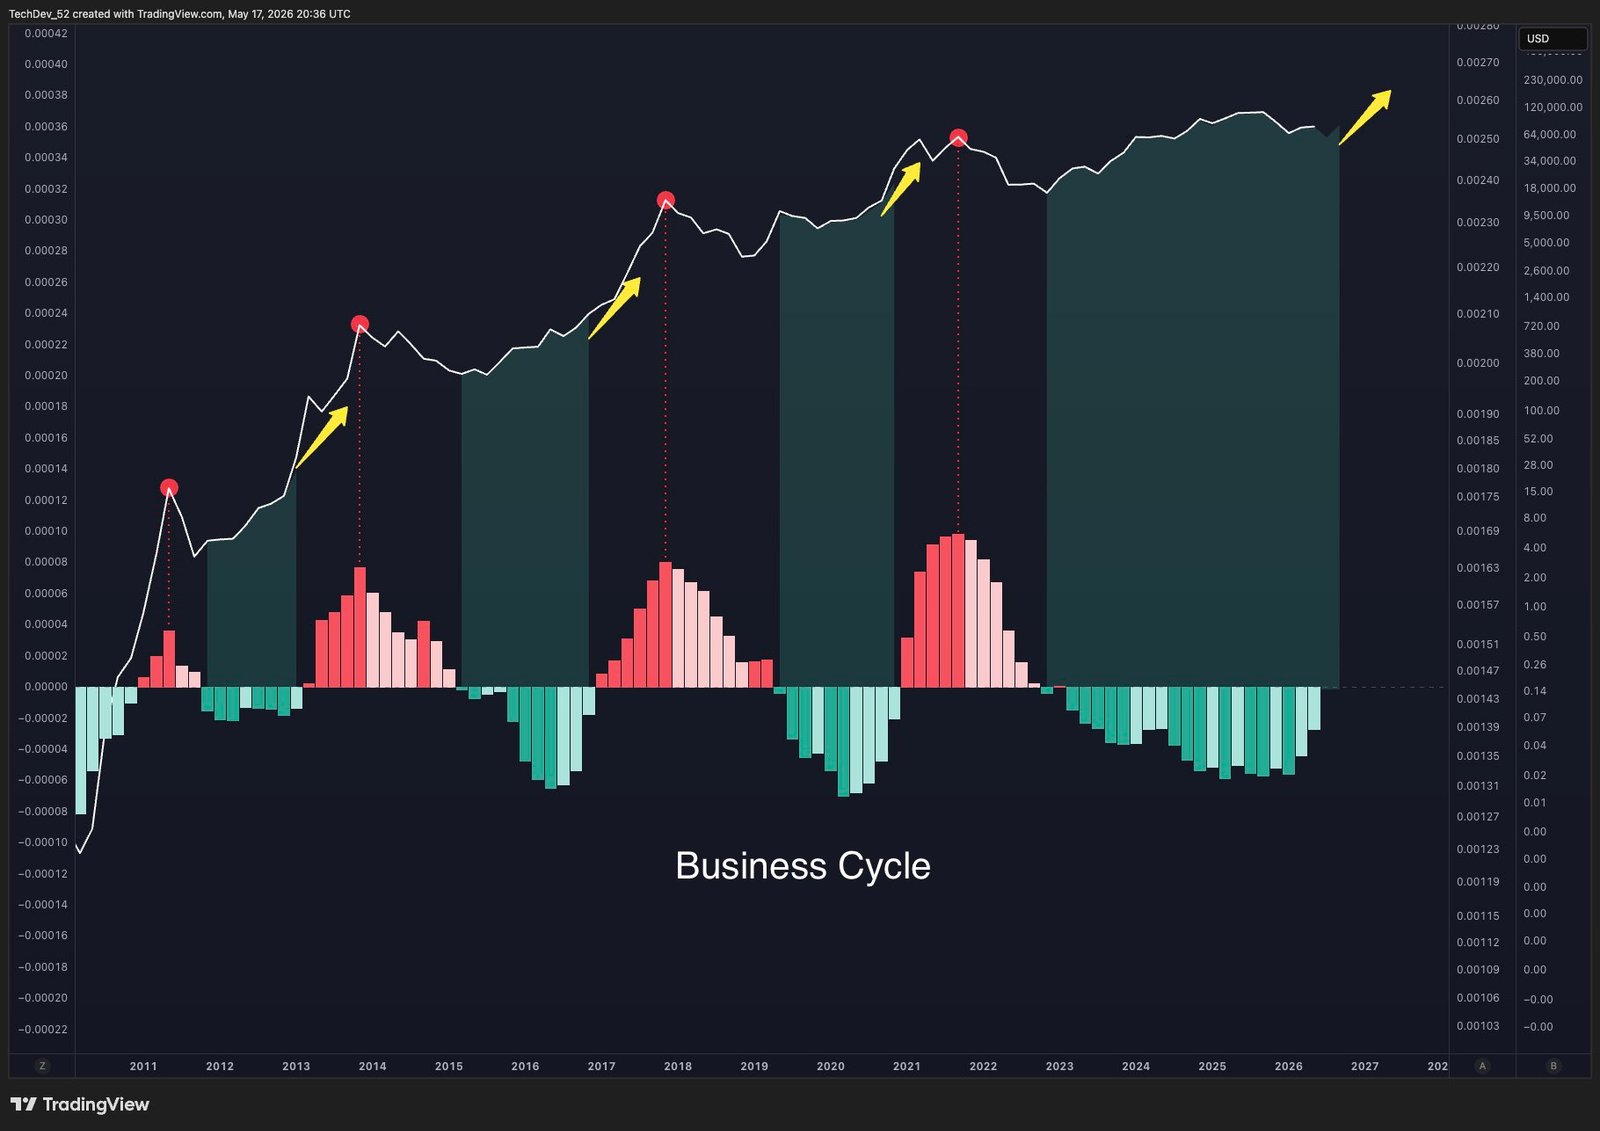
BTC/USD versus employment cycle. Source: Mark Chadwick/X
The coming days also see US nonfarm payrolls numbers, providing a snapshot of the labor market against a backdrop of rising inflation.
In a note of caution, Mosaic Asset Company reminded readers of last week’s high Personal Consumption Expenditures (PCE) inflation report.
“For investors hoping that the boost in inflation could be temporary from the jump in energy prices, the report contained bad news,” it continued.
“The core goods figure that excludes food and energy rose by 2.8% and is one of the biggest increases in decades outside of the pandemic aftermath.”
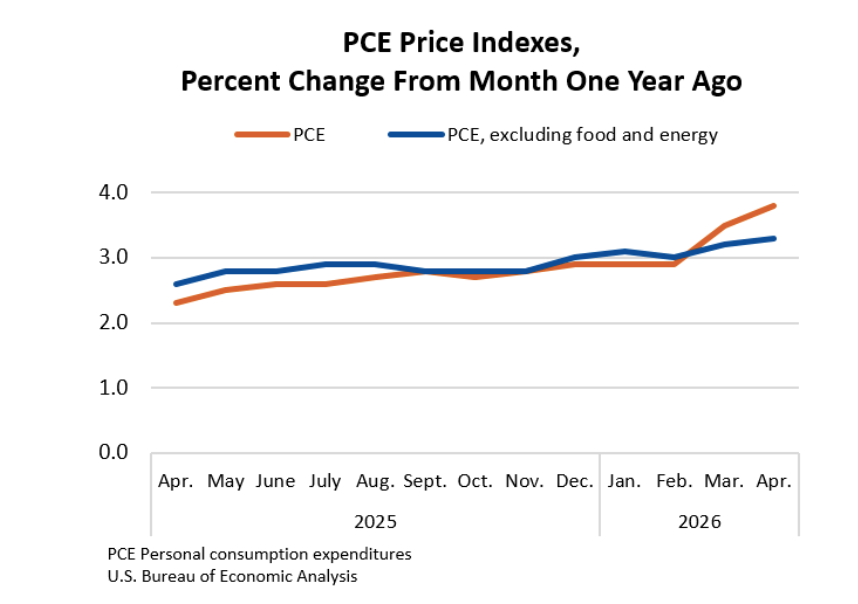
US PCE index % change (screenshot). Source: Bureau of Economic Analysis
Bitcoin long-term holders may produce a new bear-market low
Bitcoin holder trends mean that the BTC price bottom may well still be ahead in the 2026 bear market.
New findings from onchain analytics platform CryptoQuant cast doubt on the BTC price rebound from multiyear lows near $60,000.
“A rebound during a downtrend is hard to read as a bottom, because even within it the LTH (long-term holder) UTXO share keeps rising rather than declining,” contributor AbstractRyu wrote in a Quicktake blog post on Monday.
The post compares unspent transaction outputs (UTXOs) involving coins dormant for more than or less than six months, with the former classed as LTH coins.
“On Realized Cap – UTXO Age Bands (%), there are only two ways the LTH (6m+) share grows: existing holdings age in place without being spent, or STH (short-term holder) coins cross the six-month mark and reclassify as LTH,” it explains.
“Neither reflects fresh demand reviving turnover. That is why a rising share, on its own, is hard to read as bullish.”
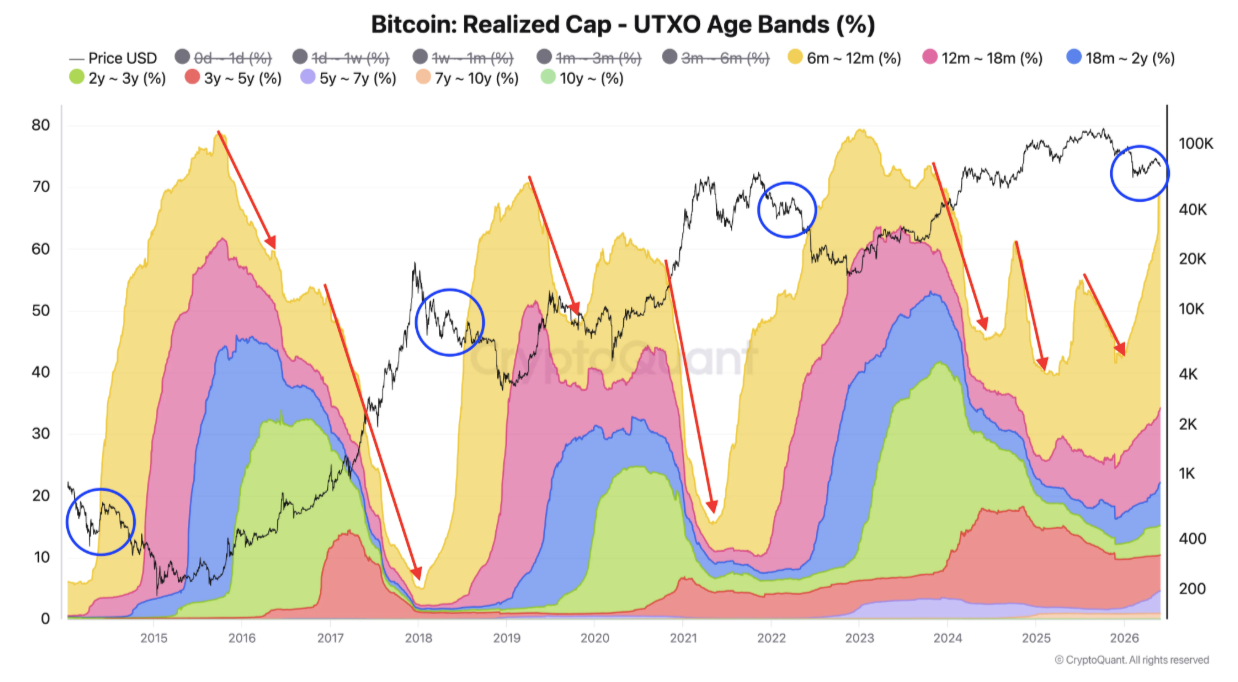
Bitcoin UTXO age data (screenshot). Source: CryptoQuant
As such, even BTC/USD rebounding by $20,000 versus its local lows is not enough to insure the market against a new macro floor. For this, LTH activity must pick up via some form of “distribution” phase.
“At present, the LTH band share has not declined at all, even through the rebounds marked by the blue circles,” AbstractRyu concluded alongside an explanatory chart.
“Distribution has not begun, and last month’s rebound, too, was likely a dead-cat bounce. The bottom is not yet in.”
Bitcoin “long-leaning bias” in need of a flush
Bitcoin continues to field concerns over a “long squeeze” thanks to overly bullish bets on BTC price action.
Related: Bitcoin price record 90-day uptrend ‘resembles bull market rally:’ New analysis
In an analysis over the weekend, CryptoQuant contributor Nino flagged positive funding rates as an ongoing signal to be “cautious” in the current market.
Funding rates, as Cointelegraph reported, have flipped net positive, indicating a “long-leaning bias” among traders.
Now, on a three-day rolling basis, funding is approaching its highest levels since the start of the year — even as price action itself tracks sideways.
“Recent market observations suggest that the 72-period moving average cluster for funding rates is showing a positive bias, approaching levels reminiscent of the peak seen in late January 2026,” Nino summarized.
“Coupled with the current stagnation in price action, this dynamic could imply an accumulation of long positions that have yet to translate into sustained upward momentum.”
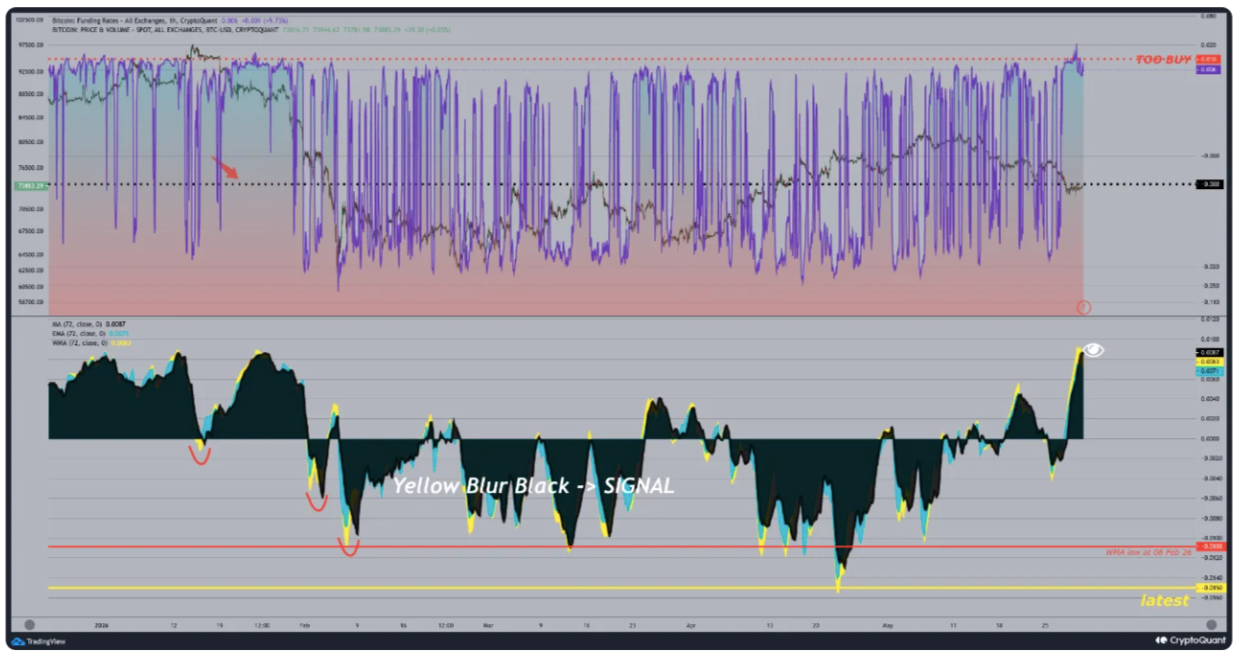
Bitcoin funding rate data (screenshot). Source: CryptoQuant
The implication is that price could redress the balance of longs and shorts by liquidating the former with a drop to new local lows.
“Consequently, the short-term outlook appears somewhat cautious, raising the possibility of a near-term downward leg as the market might need to clear potential excess leverage,” Nino added.
In its own analysis, crypto sentiment platform Santiment described the overall market mood as its most “lopsided positive” of 2026 so far.
“The current euphoria contrasts sharply with the bearish ETF flow picture and warrants caution,” it advised.
Read the full article here
Fact Checker
Verify the accuracy of this article using AI-powered analysis and real-time sources.