


Listen to the article
Bitcoin (BTC) counts down the final days of April with a fresh attack on $80,000 as price teases key breakouts.
- Bitcoin sees its first weekly close above a key trend line since October 2025.
- Liquidity grabs ramp up as traders eye a potential support retest closer to $70,000.
- The Federal Reserve interest-rate decision and inflation data form macro volatility catalysts.
- Analysis sees the “end of capitulation” on Bitcoin as institutions shore up the market.
- US manufacturing data could allow BTC/USD to avoid a retest of its macro lows.
Bitcoin closes above 21-week trend line for the first time in six months
Bitcoin may have failed to tap $80,000 or even hold its latest gains, but the weekly close was still significant.
After a last-minute push higher, BTC/USD managed to close out the weekly candle just above a key trend line, data from TradingView confirms.
BTC/USD one-hour chart with 21-week EMA. Source: Cointelegraph/TradingView
This was its 21-week exponential moving average (EMA) — a resistance feature on the chart in place since October 2025. The last weekly close above it was when the pair traded at nearly $115,000.
As Cointelegraph reported, the 21-week EMA was already on the radar for trader and analyst Rekt Capital.
A weekly close above it, he argued last week, was a prerequisite for avoiding a support retest of $73,000.
“Unless BTC is able to reclaim the 21-week EMA as support… Then this EMA could indeed force BTC into a post-breakout retest of the top of the Double Bottom price broke out from last week,” he told X followers.
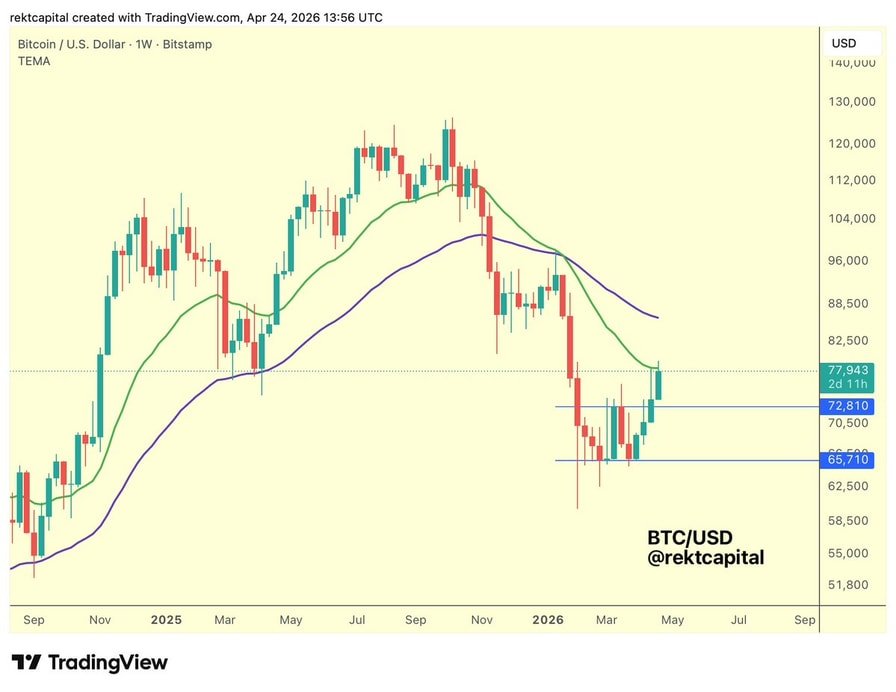
BTC/USD one-week chart. Source: Rekt Capital/X
The 21-week EMA currently forms the upper boundary of Bitcoin’s bull market support band, together with the 20-week simple moving average (SMA) at $76,550.
Similarly, it was in October last year that price completed a weekly close fully above the band’s two trend lines.
Last week, trader Daan Crypto Trades said that such an event “could confirm the end of this down trend and further relief bounce.”
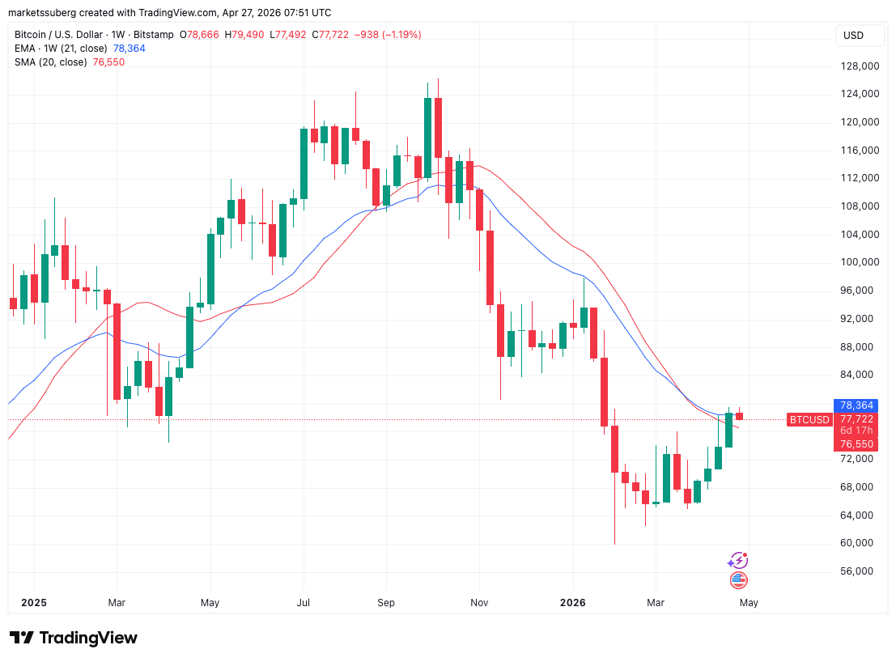
BTC/USD one-week chart with bull market support band. Source: Cointelegraph/TradingView
Liquidity grabs drive low-time frame BTC price action
On short time frames, the BTC price landscape is offering traders mixed signals.
As overall strength persists despite geopolitical uncertainty, bulls continue to struggle with reclaiming key support lines.
“Some great momentum on $BTC lately, however there are some crucial levels to consider,” crypto trader Michaël van de Poppe commented in his latest analysis on X.
Van de Poppe said that price breaking through $79,000 opens up the path to levels up to $100,000, which will nonetheless “take time.”
“If there’s no clear breakout at $79K, it wouldn’t be surprising to expect some period of consolidation before there’s another test of the resistance,” he reasoned.
“In that case, there’s a level that I prefer to see hold: $73.5k+.”
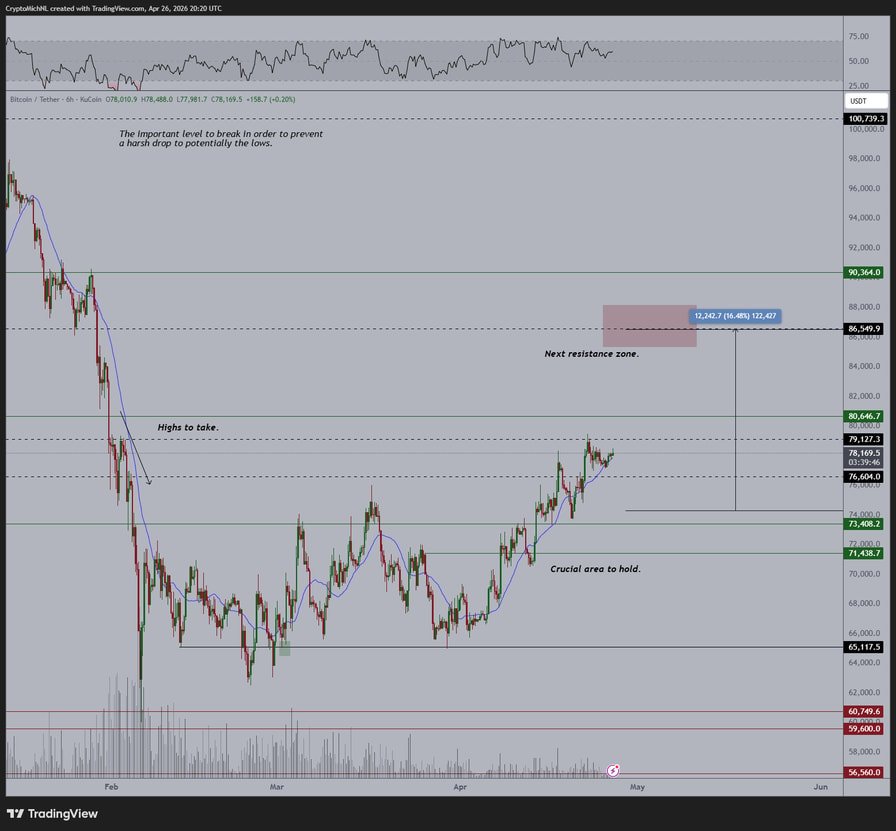
BTC/USDT six-hour chart. Source: Michaël van de Poppe/X
Earlier, Cointelegraph reported on expectations of a fresh BTC price comedown and even new macro lows.
Van de Poppe added that such an outcome could occur should the $73,000 area fail.
Continuing, trader CrypNuevo suggested that liquidity grabs could bring about that trip to the lower end of the $70,000-$80,000 corridor.
After the weekly close, BTC/USD took out late shorts above $79,000 before rapidly heading downward, liquidating newly placed longs, data from CoinGlass shows.
-2026-04-27_10_54_38.png)
BTC 24-hour liquidation heatmap. Source: CoinGlass
“Price could take the upside liquidations first in a range highs deviation, before going for the lower ones at $70k mid-range,” CrypNuevo predicted.
He added that both $70,000 and $80,000 had an “interesting amount” of potential liquidations to offer.
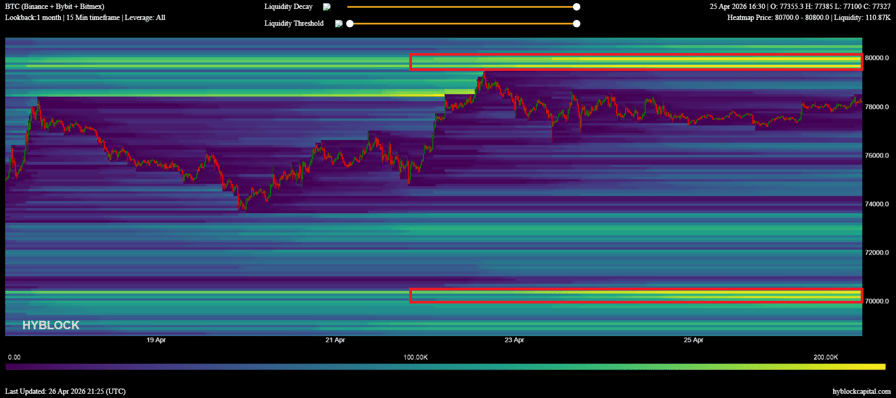
BTC liquidation heatmap. Source: CrypNuevo/X
Powell’s final Fed FOMC meeting brings stocks warning
With markets still unsure of the roadmap for the US-Iran war, risk appetite is nonetheless “returning,” analysis says.
This week has begun with the hope of further negotiations to end the conflict, this time thanks to an Iranian proposal.
Bitcoin appeared to find reason for relief on the news, hitting new multimonth highs before quickly retracing.
“Risk appetite continues to grow rapidly in this market,” trading resource The Kobeissi Letter wrote in an X response as BTC/USD neared $79,500.
Macro volatility is set to continue in the coming days, thanks also to US macroeconomic events.
Wednesday will see the Federal Reserve’s next decision on interest-rate changes, and markets will be watching Chair Jerome Powell’s press conference for cues when it comes to future policy.
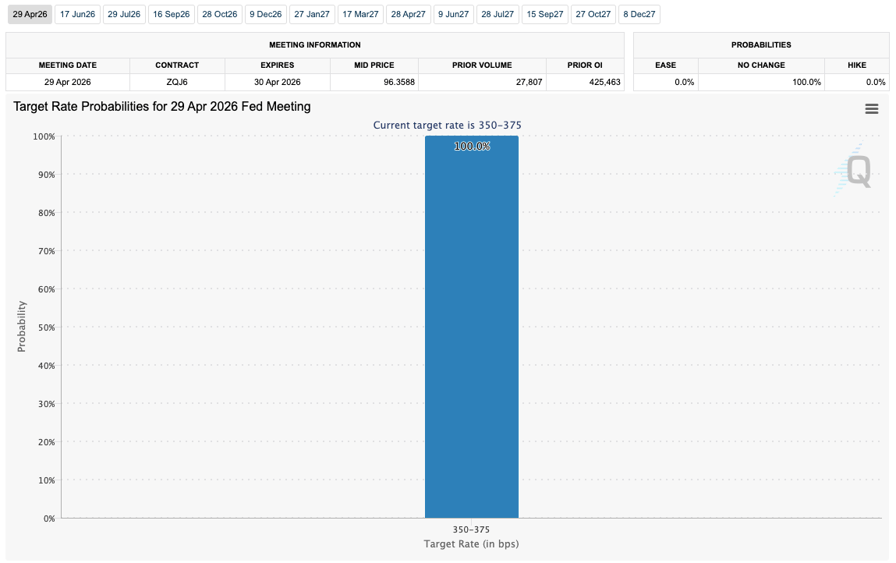
Fed target rate expectations for Wednesday’s FOMC meeting (screenshot). Source: CME Group FedWatch Tool
The war has added new inflation risks for the US, and Thursday’s release of the Fed’s “preferred” inflation gauge should reflect its impact on the trend.
This week also marks the last Federal Open Market Committee (FOMC) meeting with Powell as Chair, ahead of the assumed takeover by Kevin Warsh.
“New Fed chairs have a history of being greeted with market volatility,” trading resource Mosaic Asset Company noted in the latest edition of its regular analysis series, The Market Mosaic.
An accompanying chart put the average S&P 500 drawdown in the year a new Fed chair takes over at 20%.
S&P 500 drawdowns under new Fed chairs. Source: Mosaic Asset Company
BTC price analysis sees “structural bottom” in place
Bitcoin near $80,000 has led analysts to suggest that the “end of capitulation” is already here.
In one of its QuickTake blog posts on Monday, onchain analytics platform CryptoQuant pointed to institutional investors as the key supporting factor during the 2026 bear market.
“During the Hormuz Shock, large investors refused to sell their Bitcoins and the panic in derivatives was irrelevant, as institutional conviction was already cemented,” contributor GugaOnChain summarized.
In early February, CryptoQuant argued, when BTC/USD briefly fell to near $60,000, a “purge” of low-conviction investors had already been underway for several months.
“Operators took profits, purging weak hands and retreating the support to $54.5K,” GugaOnChain continued, referring to Bitcoin investors’ average cost basis, also known as realized price.
“In practice: the retail that paid the speculative premium at $90K entered absolute panic with the free fall. Forced to sell at a loss, they returned their Bitcoins to the Smart Money in the $62K zone, establishing an early support above the fair price.”
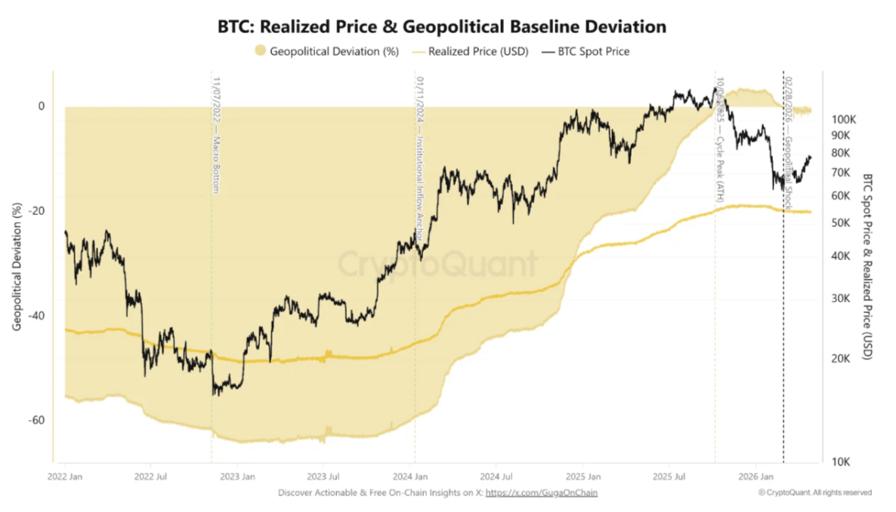
Bitcoin realized price data (screenshot). Source: CryptoQuant
CryptoQuant described the “apex” of the process occurring in February, with a recovery underway ever since.
“The apex of this purge occurred on February 5, 2026, consolidating the ground zero of this Bear Market. With the Spot squeezed at $62.8K and the Realized Price (RP) at $55.3K, the deviation was only 1.34%,” GugaOnChain explained, calling a “structural bottom.”
“Unlike the absolute capitulation of 2022, when the price crossed below the network’s base, this time the panic stalled at a 13% distance from the Wall. Institutional capital erected a concrete floor before the abyss, exhausting the selling power of investors without conviction.”
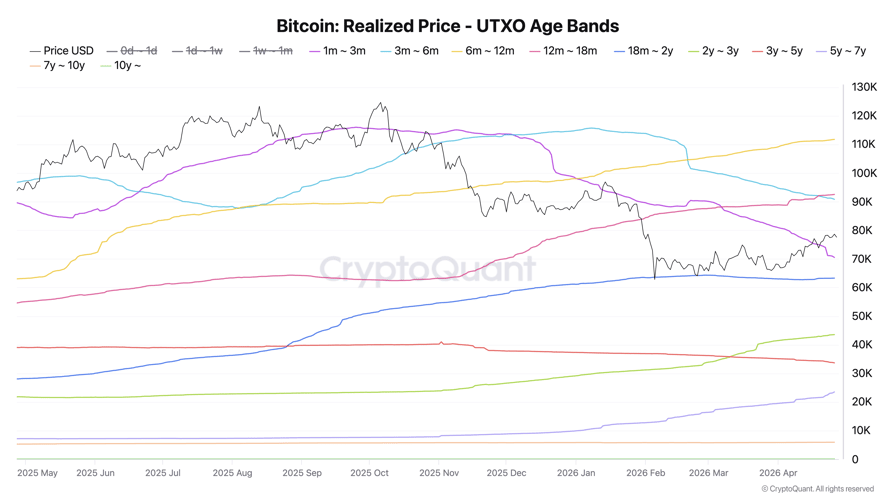
Bitcoin realized-price data ordered by date coins moved onchain. Source: CryptoQuant
US macro data may save Bitcoin from new bear-market low
Throughout the current macro volatility, US Purchasing Managers’ Index (PMI) has formed a key upside catalyst for crypto and risk assets.
Related: Bitcoin Bull Score hits six-month high as 2022 bear-market fears linger
This is set to continue, with PMI entering an “expansion” phase for the first time since 2022.
For commentator Matthew Hyland, this now has implications for Bitcoin price action for the rest of 2026. In this bear-market year, BTC/USD should find a bottom in Q4, matching 2022 — but PMI should change the landscape.
“Because of the strength of the PMI expansion trigger along with the other 10+ signals I do not believe the ‘4 year cycle’ works out as most expect,” he wrote on X.
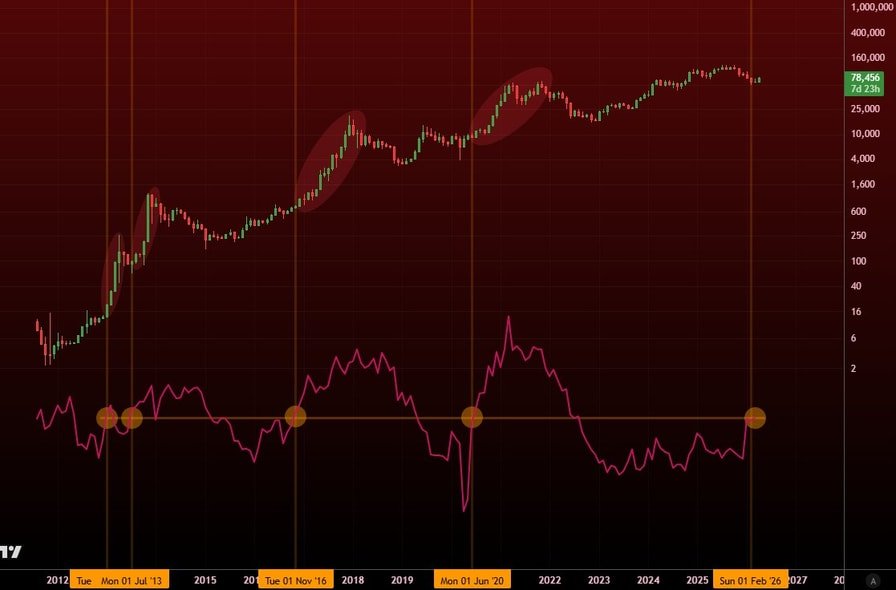
BTC/USD versus US PMI data. Source: Matthew Hyland/X
Instead of beating its February lows, Bitcoin should instead put in “higher low” near $60,000, contrary to the majority’s expectations. Supporting this, Hyland made reference to “10+ signals” showing that the new bottom is already in place.
“My invalidation would be a severe black swan something worse than the past few months however black swans are NOT likely so Its low percentage odds of being invalidated and not favorable to happen,” he added.
Read the full article here
Fact Checker
Verify the accuracy of this article using AI-powered analysis and real-time sources.