


Listen to the article
Hotter US PPI inflation data boosted precious metals but punished Bitcoin bulls, with BTC price downside nearing 3% on the day.
Bitcoin (BTC) slid further into Friday’s Wall Street open as US inflation data overshot expectations.
Key points:
-
Bitcoin price downside strengthens as US inflation data comes in hot.
-
Gold and silver benefit from a risk-off response to January PPI data.
-
Bitcoin price expectations face the prospect of a rocky monthly candle close.
Bitcoin under pressure after hot US PPI print
Data from TradingView showed daily BTC price downside nearing 2.5% on Bitstamp, while gold eyed its highest levels since late January.
The January print of the Producer Price Index (PPI) came in markedly above expectations at 0.5% month over month versus an anticipated 0.3%, per data from the US Bureau of Labor Statistics (BLS).
Core PPI fared even worse at 0.8% month over month instead of 0.3%.
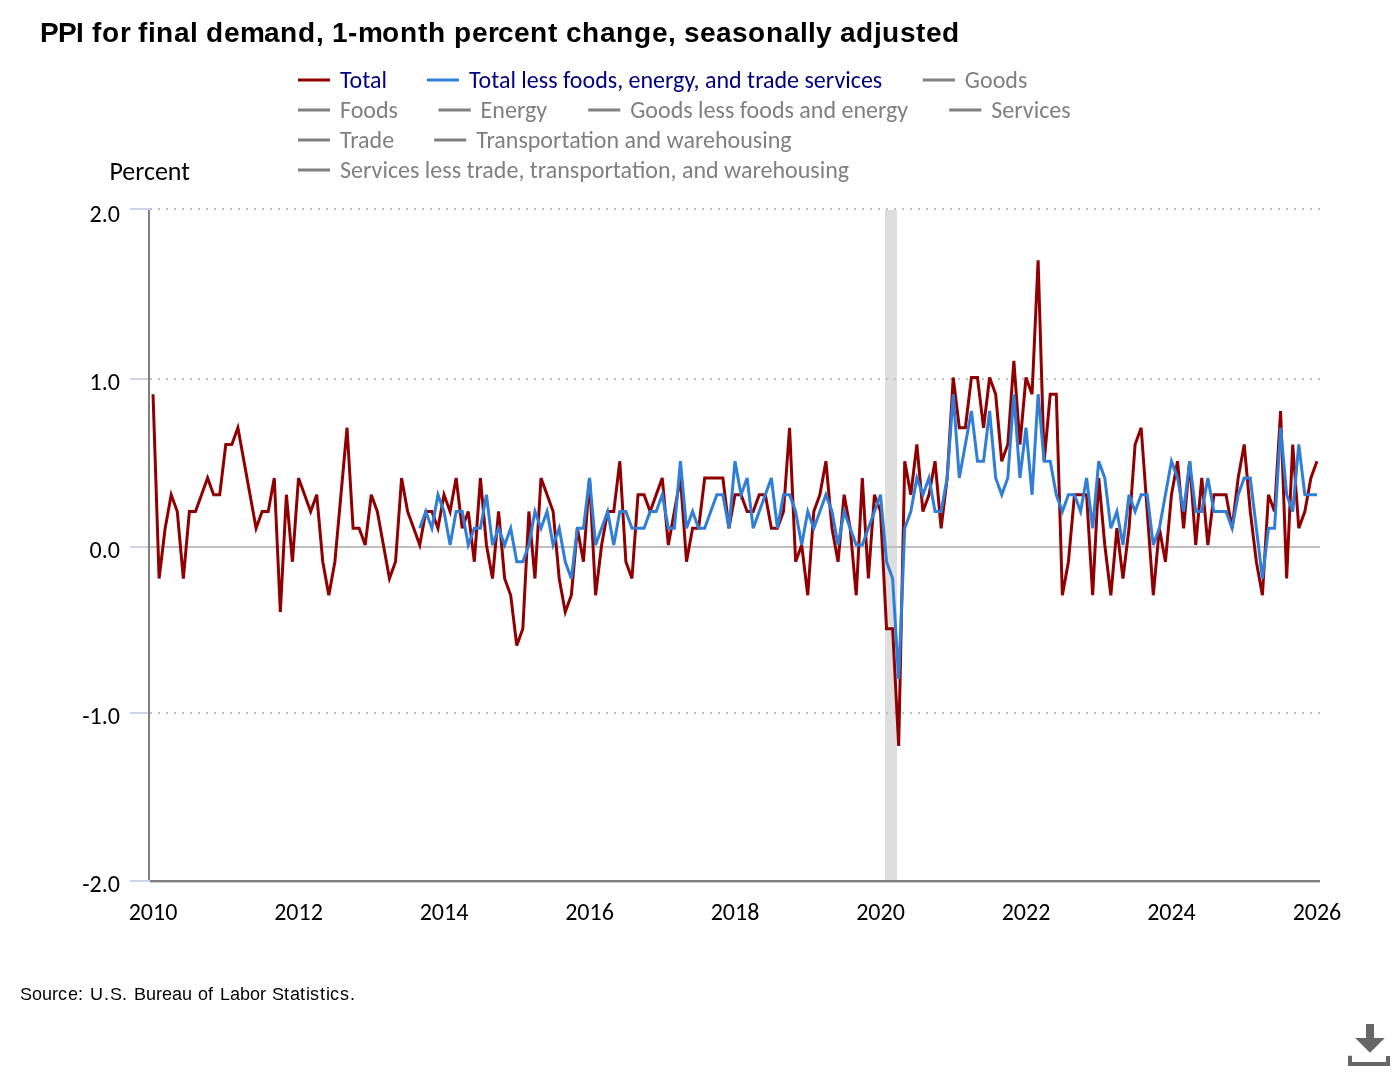
“The January increase in prices for final demand can be traced to a 0.8-percent advance in the index for final demand services. In contrast, prices for final demand goods declined 0.3 percent,” an official statement added.
With US inflation creeping higher more quickly than markets assumed, risk-asset pressure increased, while safe havens outperformed.
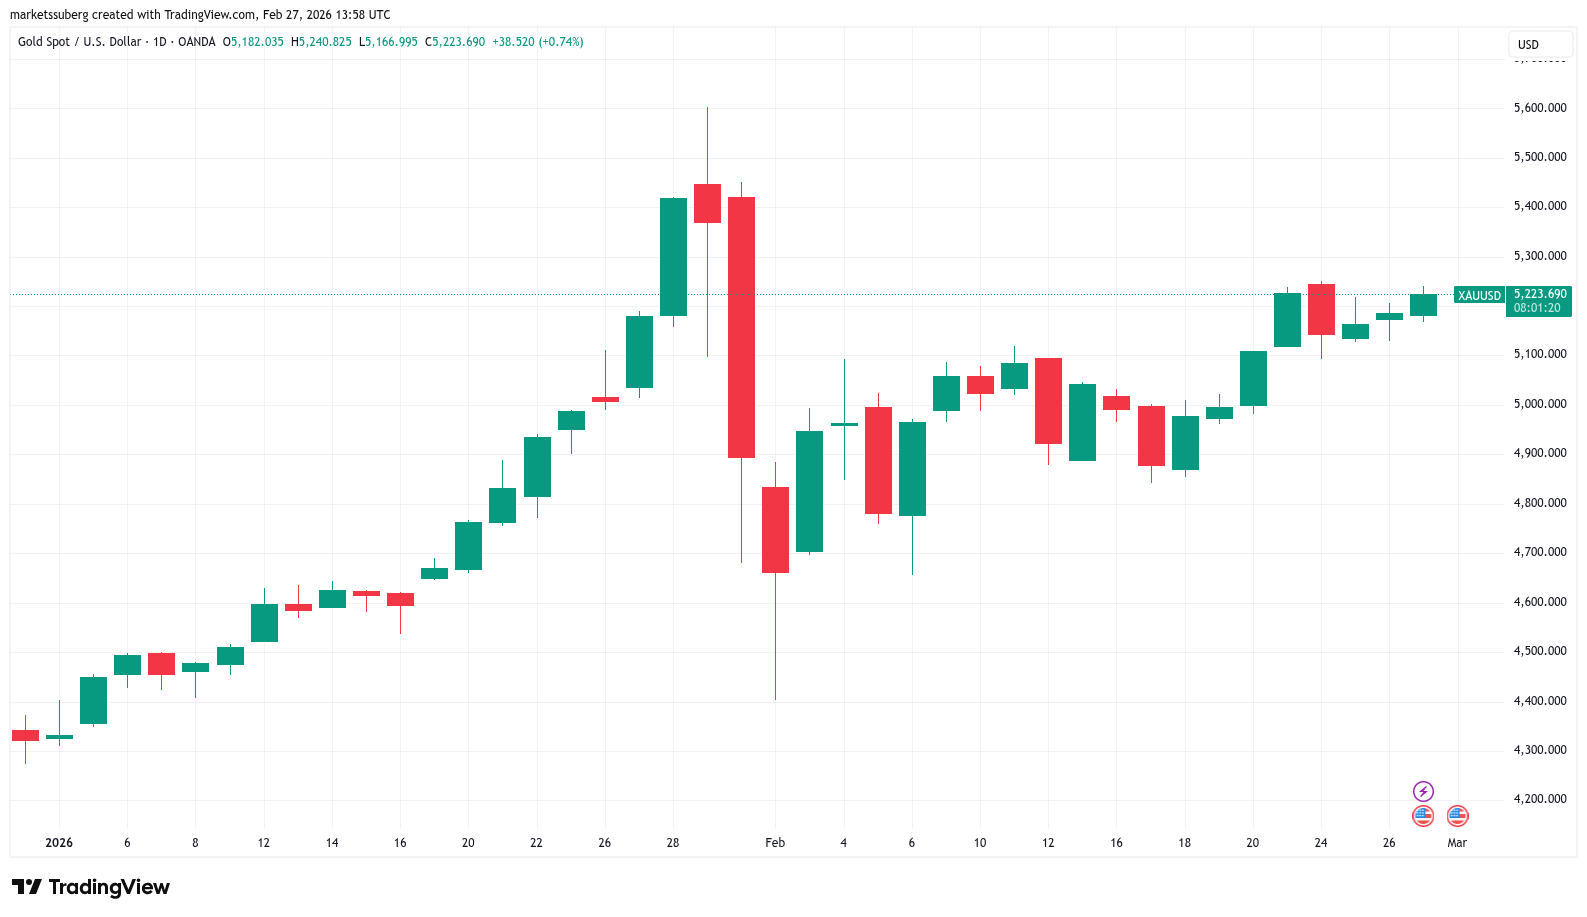
Gold passed $5,200 per ounce, while silver revisited $92 to hit its highest levels since Jan. 30.
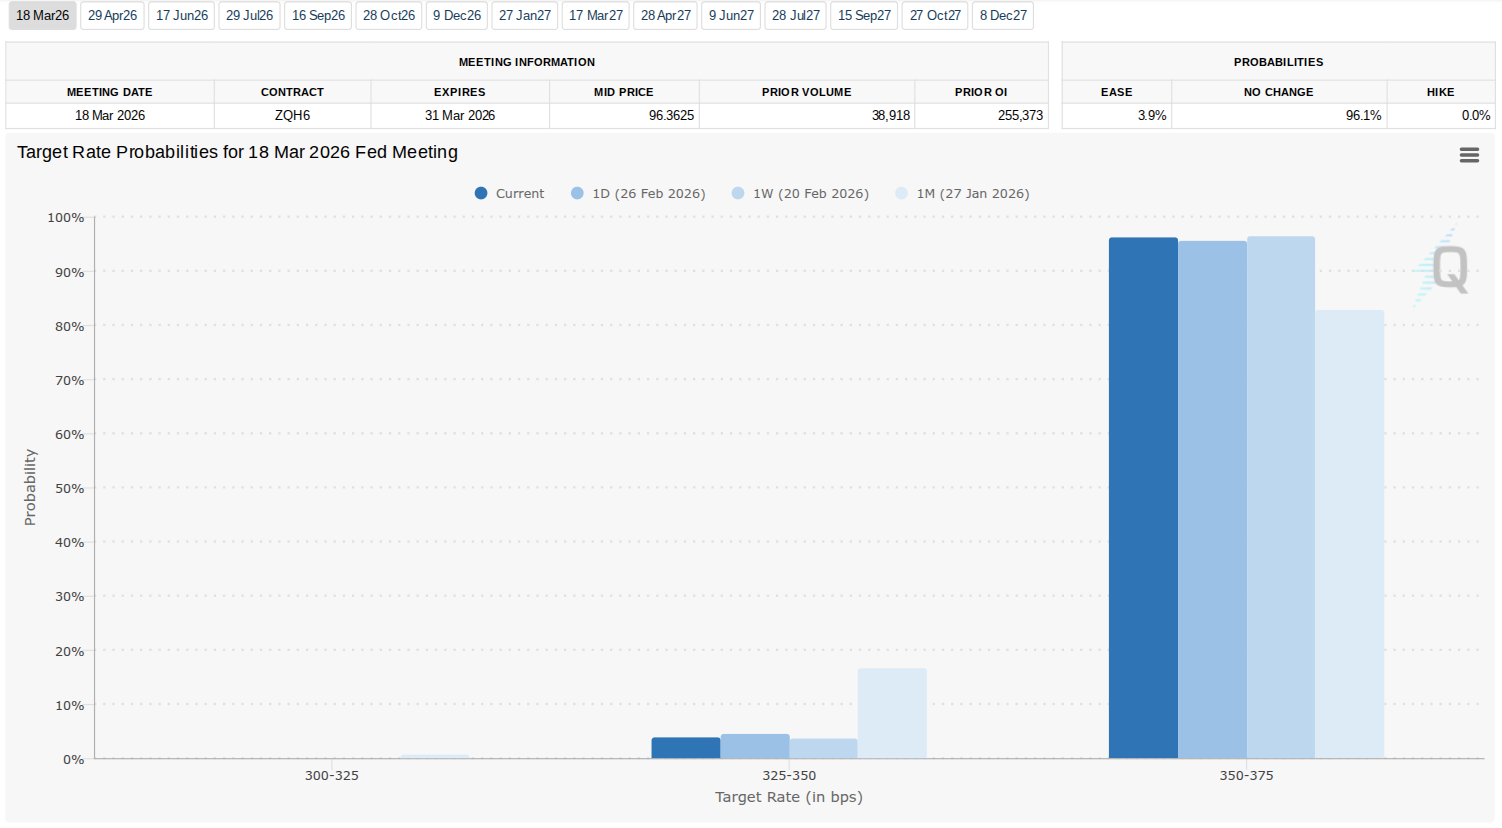
Expectations for interest-rate cuts by the Federal Reserve at its March meeting fell below 4%, according to the latest readings from CME Group’s FedWatch Tool.
BTC price fears over “massive collapse”
With the monthly close in focus, Bitcoin market participants remained on edge.
Related: Hodlers have ‘given up’ at $65K: Five things to know in Bitcoin this week
Crypto trader, analyst and entrepreneur Michaël van de Poppe warned of a possible rerun of events from early February, where BTC/USD put in 15-month lows near $59,000.
“Pretty crucial area for me to hold on to. I’d highly favor that $BTC finds a higher low at $65k,” he wrote in his latest analysis on X.
“However, last day of the month; remember last month? A massive collapse on the markets. Let’s see what it brings: holding $65K opens up the scenario to run up from here.”
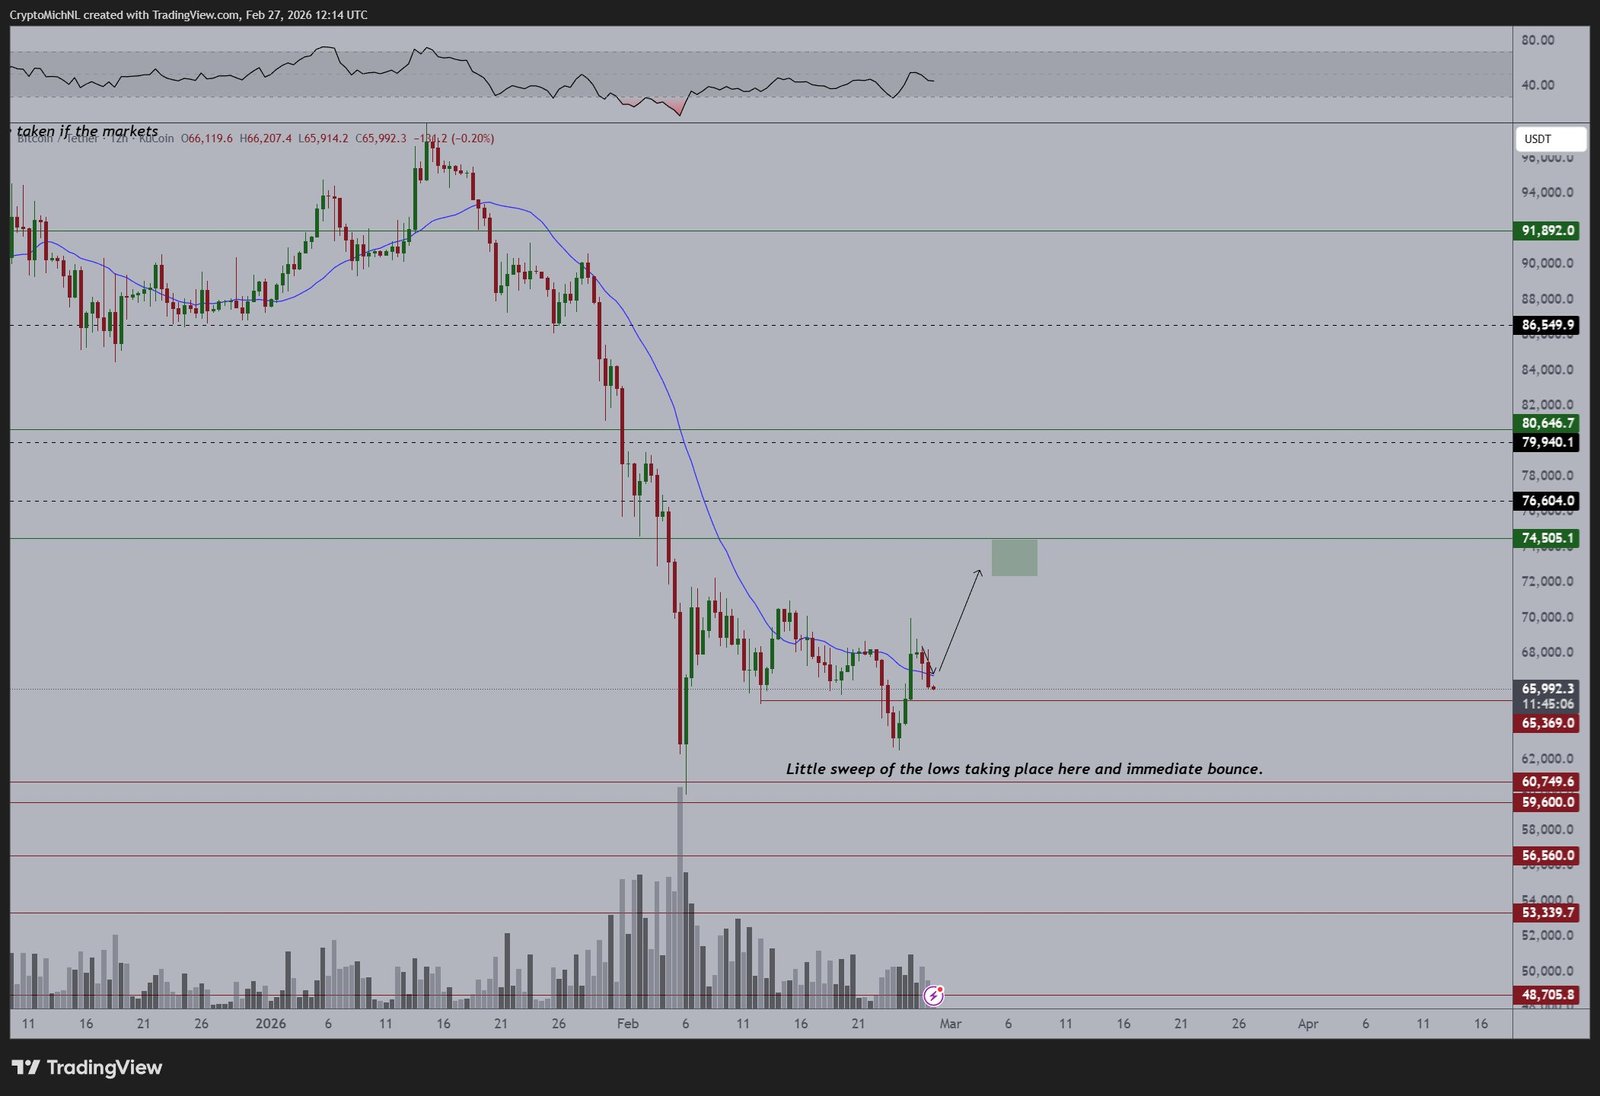
Earlier, Cointelegraph reported on key resistance levels for bulls to reclaim, notably the 200-week exponential moving average (EMA) and old all-time highs around $69,000.
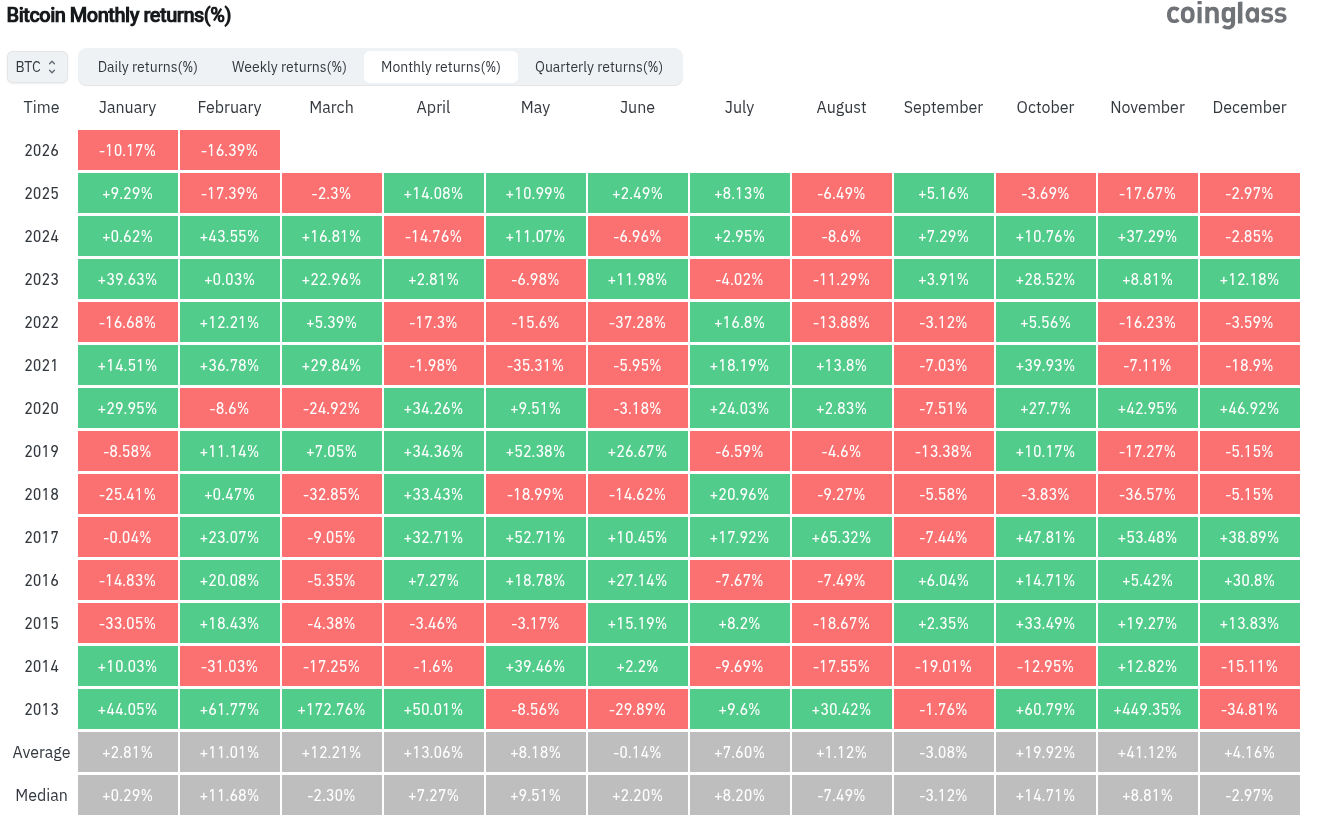
At the time of writing, BTC/USD roughly matched February 2025 in terms of performance, with losses nearing 17% month-to-date.
The pair prepared its fifth consecutive month of losses, a phenomenon absent from the charts since 2018, data from CoinGlass confirms.
This article does not contain investment advice or recommendations. Every investment and trading move involves risk, and readers should conduct their own research when making a decision. While we strive to provide accurate and timely information, Cointelegraph does not guarantee the accuracy, completeness, or reliability of any information in this article. This article may contain forward-looking statements that are subject to risks and uncertainties. Cointelegraph will not be liable for any loss or damage arising from your reliance on this information.
Read the full article here
Fact Checker
Verify the accuracy of this article using AI-powered analysis and real-time sources.