


Listen to the article
While Bitcoin (BTC) remains more than 42% below its $126,000 all-time high, several technical setups suggest that the price range between $60,000 and $72,000 may be the new bottom range, before a sustained recovery.
Key takeaways:
-
Bitcoin’s double bottom pattern suggests that a reversal is underway.
-
A bottom may form in the coming weeks as the BTC-gold ratio revisits previous cycle lows.
-
Bitcoin price is retesting a multi-year trend line that has marked previous market bottoms.
BTC double-bottom pattern hints at trend reversal
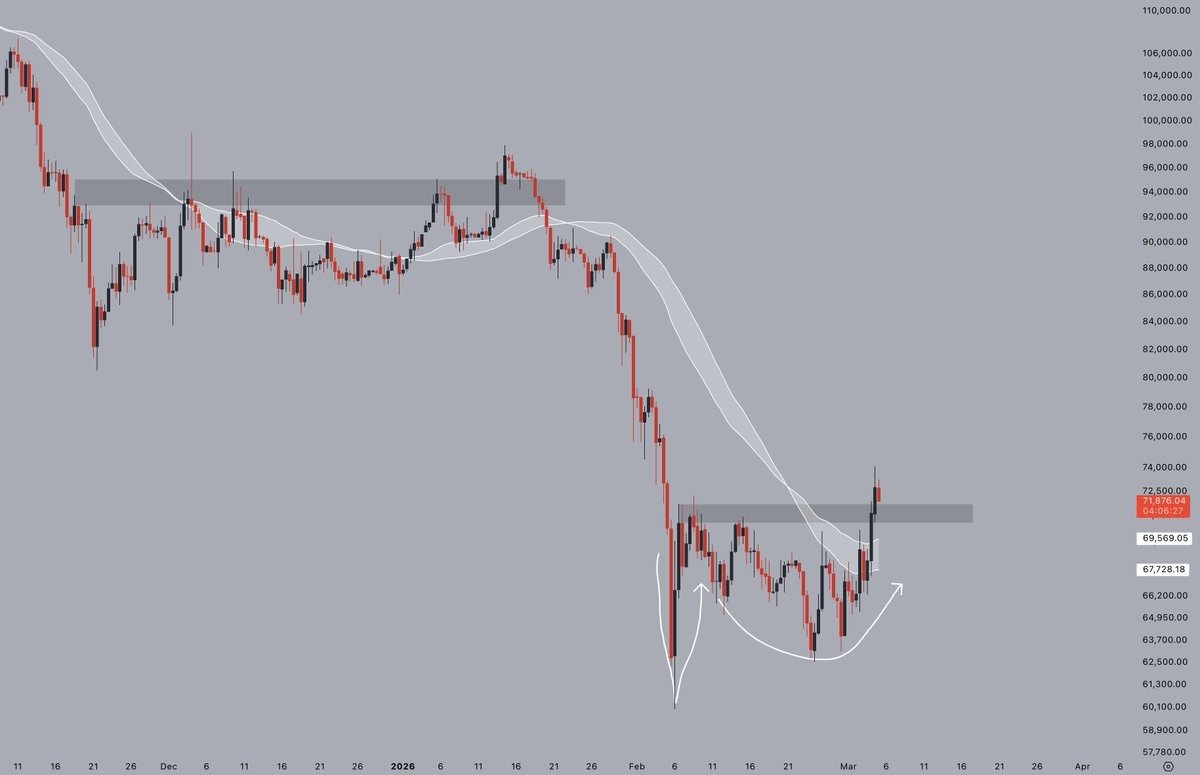
Bitcoin recovered 21% to a 30-day high of $74,000 from its multi-year low of $60,000 reached on Feb. 6, before retracing to $72,500 on Thursday.
Crypto analyst Jelle said that an “Adam and Eve bottom is still playing out” on Bitcoin’s 12-hour chart.
An Adam and Eve bottom is a bullish reversal chart pattern indicating a shift from a downtrend to an uptrend. It is a variation of the classic double-bottom pattern, which appears after a downtrend and signals that selling pressure is likely easing.
Related: Bitcoin’s bullish momentum accelerates but topping $78K remains a challenge
The pattern confirmed when the price broke out and closed above the neckline (the peak between the two bottoms) at $70,000 on Wednesday, as shown in the chart below.
The bulls must “hold the breakout area, or are we going for another nasty deviation before lower,” the analyst added.
Earlier, Cointelegraph reported that a slowdown in profit-taking was a prerequisite for BTC’s ability to hold $70,000 and confirm the recovery.
Bitcoin-gold chart flashes another bottom signal
As of March, Bitcoin’s price relative to gold has been in a downtrend for 13 months, following its peak in December 2024.
When Bitcoin falls against gold, it signals a risk-off sentiment with investors reducing exposure to BTC. This reflects fears of macroeconomic instability, geopolitical uncertainties, or a liquidity squeeze, favoring gold.
“In the 3 previous cycles, it’s taken about 14 months to go from peak to bottom,” CEO at Coinbureau Nic said in a Thursday post on X, adding:
“These also coincided with bear market bottoms.”
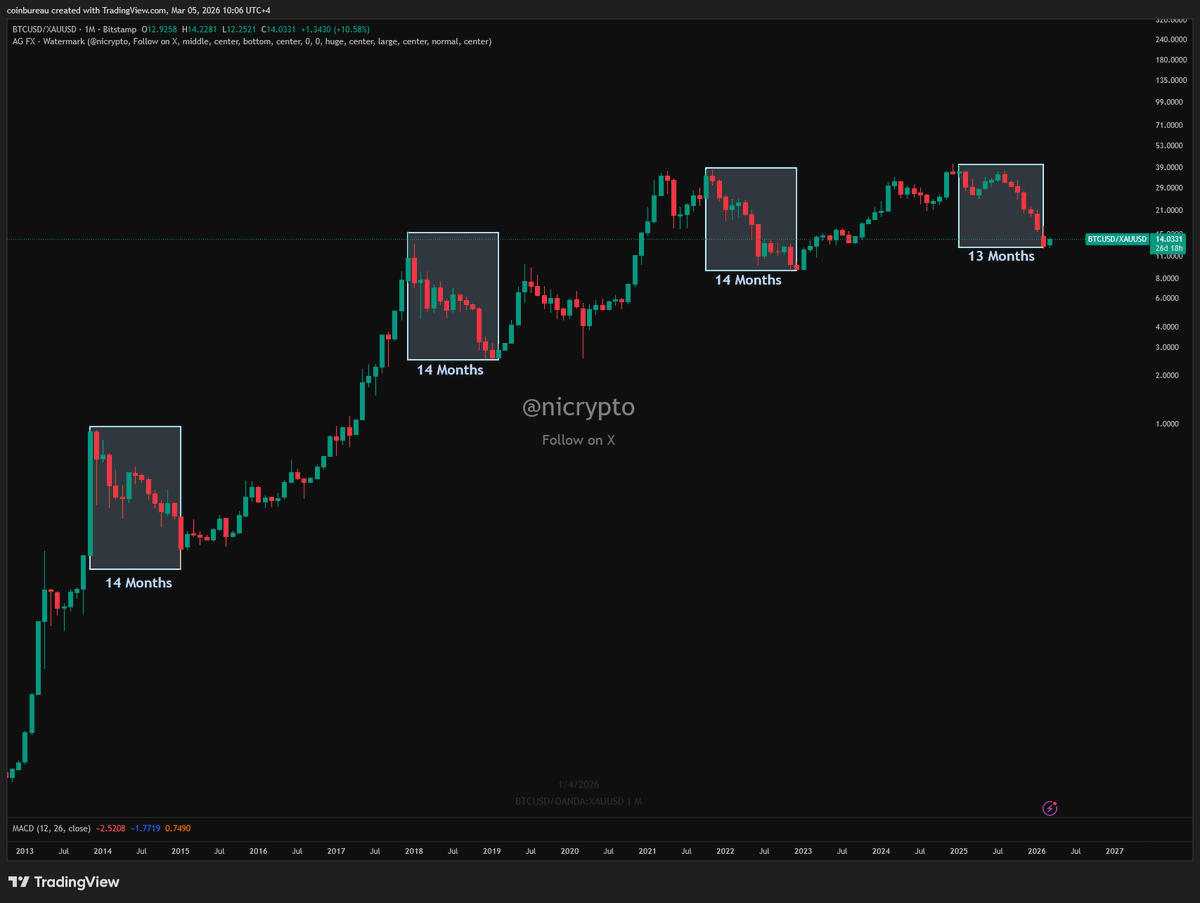
As the ratio bottomed in late 2022, BTC price also hit a macro low of $15,500 before rising 352% to its previous all-time high of $73,800, reached in March 2024.
A similar pattern played out in 2018 and 2014, when Bitcoin price gained between 300% and 450% a year after the BTC/XAU pair bottomed out.
Therefore, the current 13-month drawdown from the last ratio peak suggests the bottom may be imminent.
Bitcoin’s ascending channel hints at a cycle bottom
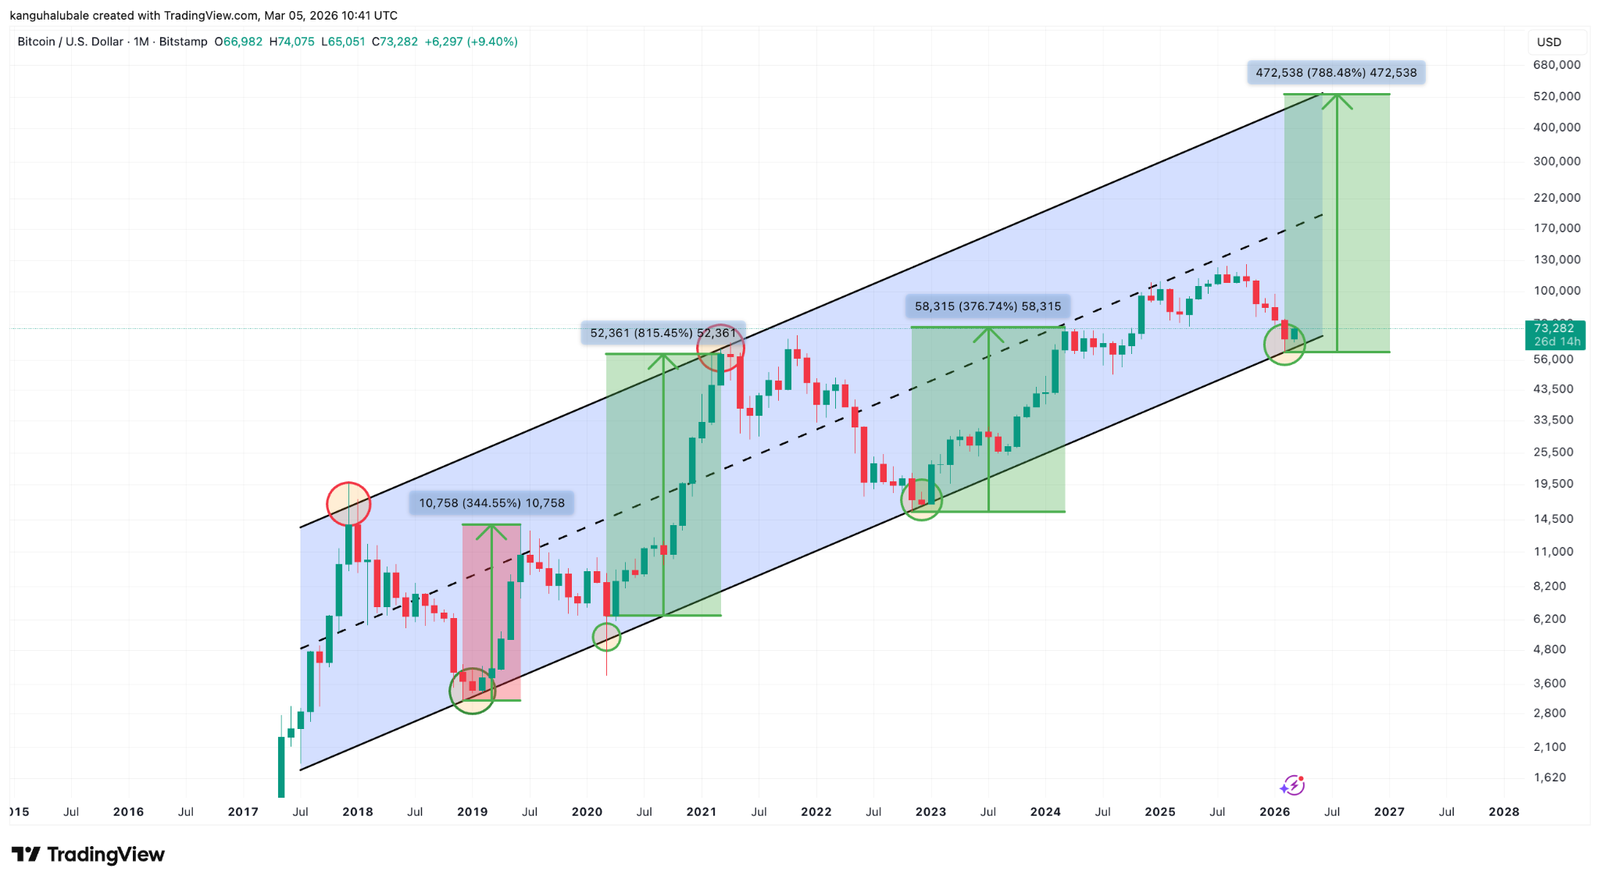
Data from TradingView shows BTC price retesting a multi-year support trend line on the monthly time frame.
The chart below shows that this trend line has previously marked bear market bottoms in Bitcoin, as seen in 2018 and 2022.
“Bitcoin is now approaching the historical bottom level at the trend line,” trader and analyst at Coinvo Trading said in a video post on X, adding:
“If history plays out, Bitcoin is going to retest this trend line and then top out somewhere around $500K. ”
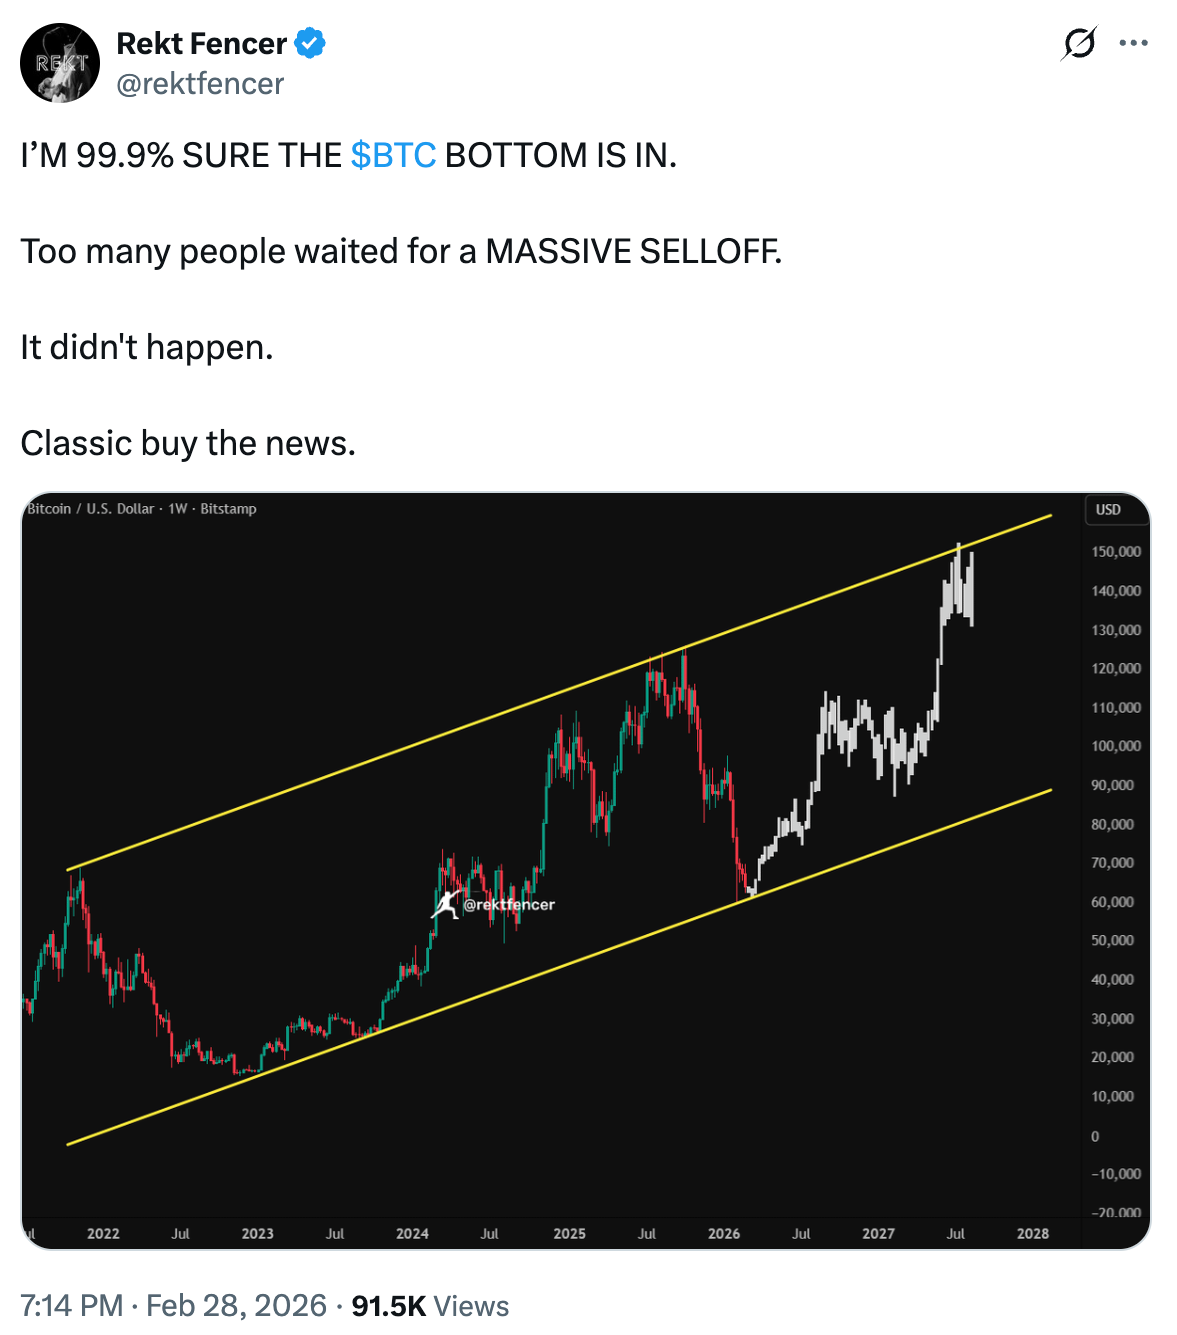
Fellow analyst Rekt Fencer said that he was “sure the BTC bottom is in” after spotting a similar pattern in the weekly time frame, with the price retesting a trend line that marked the 2022 bottom.
As Cointelegraph reported, several technical indicators suggest that Bitcoin is nearing a potential bottom, including the relative strength index (RSI).
This article does not contain investment advice or recommendations. Every investment and trading move involves risk, and readers should conduct their own research when making a decision. While we strive to provide accurate and timely information, Cointelegraph does not guarantee the accuracy, completeness, or reliability of any information in this article. This article may contain forward-looking statements that are subject to risks and uncertainties. Cointelegraph will not be liable for any loss or damage arising from your reliance on this information.
Read the full article here
Fact Checker
Verify the accuracy of this article using AI-powered analysis and real-time sources.