Listen to the article
Key takeaways:
-
The spot Solana ETFs start strong by drawing over $400 million in weekly inflows.
-
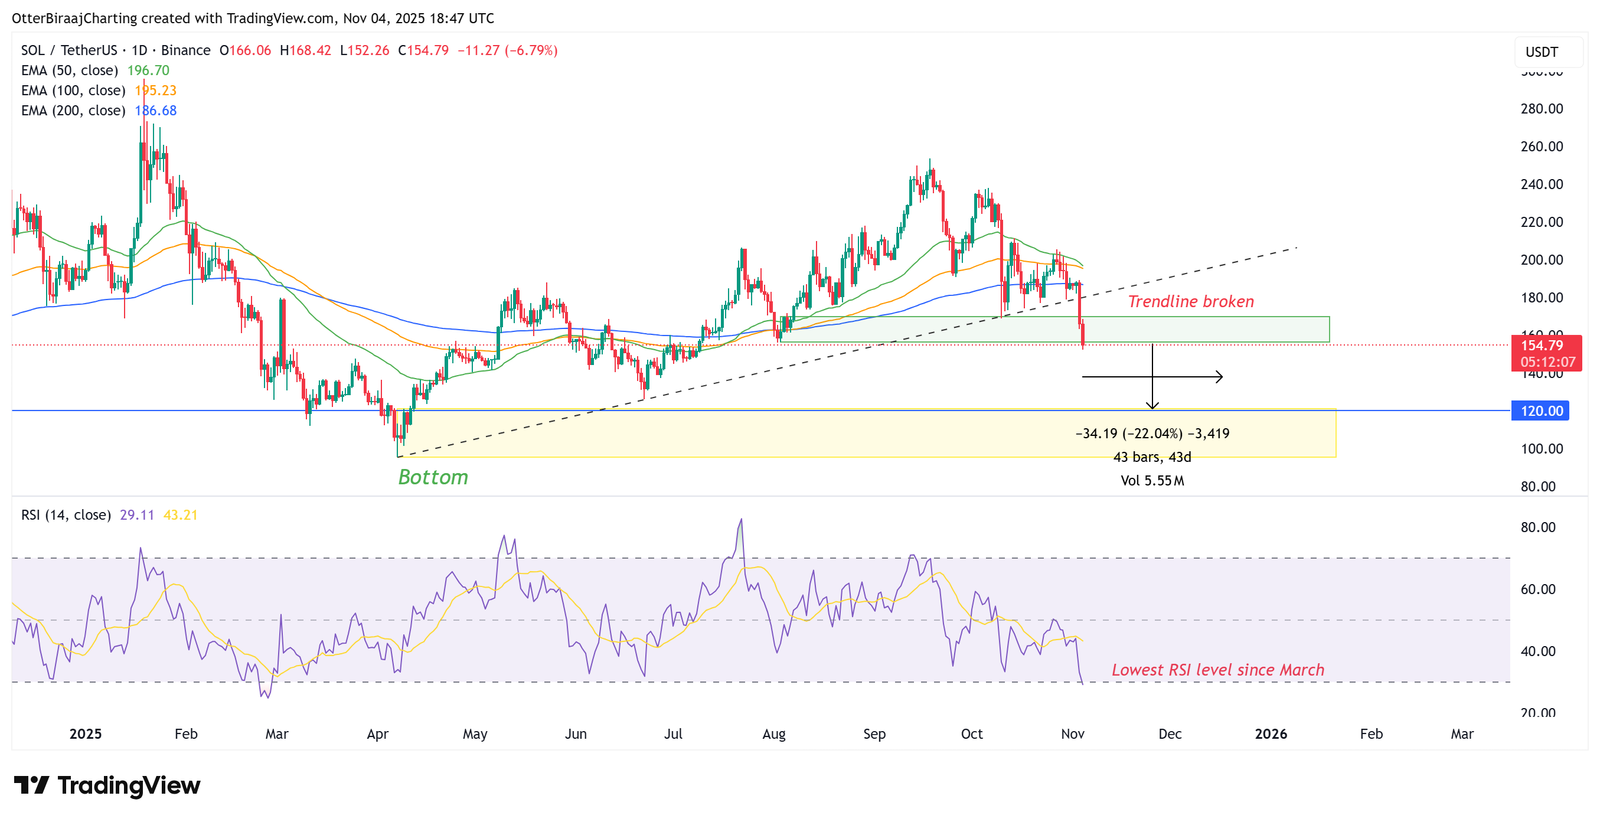
SOL broke its 211-day uptrend, slipping below key moving averages.
-
Failure to hold $155 could send SOL price into the $120–$100 range.
Spot Solana (SOL) exchange-traded funds (ETFs) start their trading journey with strength, posting record positive inflows that underscored institutional demand for the network’s native asset.
On Monday, spot SOL ETFs recorded a daily high of $70 million in inflows, the strongest since launch, taking the total spot ETF inflows to $269 million since its debut on Oct. 28.
Data from Bitwise indicated that two Solana ETFs, Bitwise’s BSOL US Equity and Grayscale’s GSOL US Equity, collectively attracted $199.2 million in net inflows (excluding seed capital) during their first week.
Bitwise’s BSOL ETF led the charge, amassing $401 million in assets under management (AUM) by Oct. 31. That figure represented over 9% of total global SOL ETP AUM and 91% of global SOL ETP flows last week. In contrast, Grayscale’s GSOL US Equity drew only $2.18 million, accounting for roughly 1% of total ETP flows.

Globally, weekly net inflows into Solana ETPs surpassed $400 million, marking the second-highest weekly inflow on record. Bitwise’s Solana Staking ETF (BSOL) was also the top-performing crypto ETP globally, ranking 16th among all ETPs across asset classes for the week.
Currently, the total Solana ETP AUM stands at $4.37 billion, with US-listed products accounting for the majority of new investment. According to Bitwise’s estimates, a $1 billion net inflow could correspond to a potential 34% increase in SOL’s price, assuming a beta sensitivity of 1.5.
Related: Solana treasury Forward Industries authorizes $1B share repurchase
Solana price breaks key downtrend: Will it drop another 20%?
Despite the record inflows, SOL’s price action turned sharply bearish this week, falling over 16%, dropping to $148.11 on Tuesday, its lowest level since July 9. The correction also broke a 211-day uptrend that began on April 7, with the $95 level serving as the yearly low.
Solana is currently testing a daily order block between $170 and $156, an area with limited support. The downturn has pushed the price below the 50-day, 100-day, and 200-day EMAs, signaling potential bearish confirmation on the daily chart.

With liquidity lows around $155 now being tested, SOL could stage a mean reversion recovery if buyers defend this zone, especially as the relative strength index (RSI) hits its lowest level since March 2025.
However, acceptance below $160 and a failure to hold $155 could expose the next downside target between $120 and $100, marking a deeper correction phase unless a short-term rebound materializes soon.
Related: Hawkish Fed triggers $360M in crypto outflows as Solana ETFs buck trend
This article does not contain investment advice or recommendations. Every investment and trading move involves risk, and readers should conduct their own research when making a decision.
Read the full article here
Fact Checker
Verify the accuracy of this article using AI-powered analysis and real-time sources.


