


Listen to the article
Key points:
-
Bitcoin bulls have pushed the price above $69,000, signaling solid dip buying at lower levels.
-
Several major altcoins have turned up sharply, suggesting that selling pressure is reducing.
Bitcoin (BTC) bulls purchased Tuesday’s dip and are attempting to sustain the price above $69,000 on Wednesday. According to SoSoValue data, BTC exchange-traded funds recorded net inflows of $257.7 million on Tuesday, the largest inflows since Feb. 6. That suggests investors are viewing the dips near $60,000 as a buying opportunity.
Santiment said in a post on X that BTC’s correlation with stocks has broken down in the past six months. The S&P 500 rose 7% during the period, while BTC fell 43%. However, the on-chain data provider added that the disconnection is unlikely to stay forever. If BTC follows its historical pattern of tracking equities during economic expansions, then “it may have significant room to catch up.”
Not everyone is bullish on BTC’s prospects in the short term. Glassnode said in a post on X that BTC’s realized profit/loss ratio (90-day moving average) slipped below 1. Historically, breaks below 1 have resulted in at least six months of loss realization before the level was reclaimed.
Could BTC and select major altcoins break above their overhead resistance levels? Let’s analyze the charts of the top 10 cryptocurrencies to find out.
Bitcoin price prediction
BTC has risen sharply from the $62,510 level on Tuesday, indicating that the bulls are vigorously defending the $60,000 level.
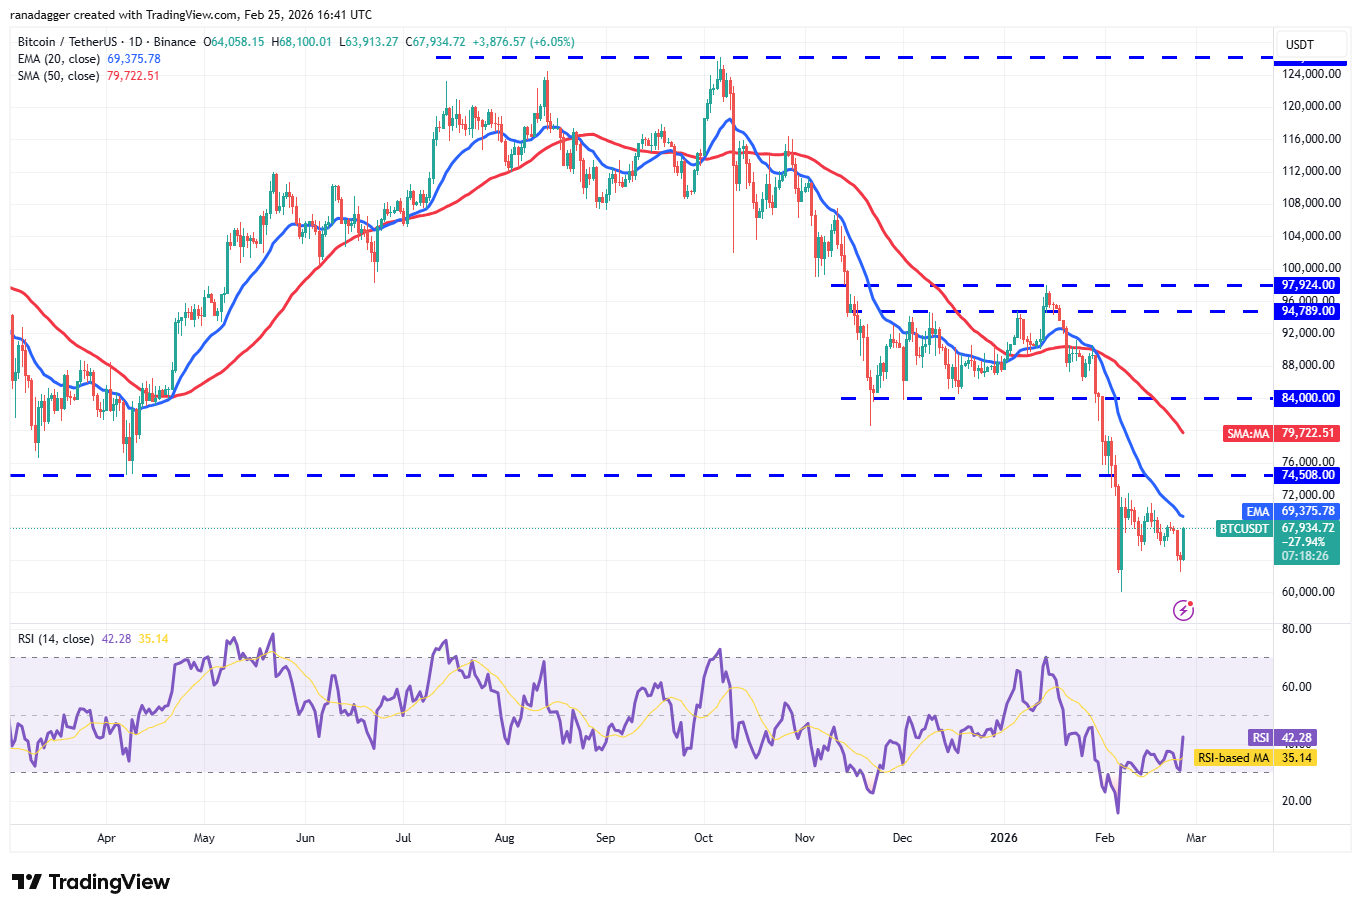
Buyers will attempt to thrust the Bitcoin price above the 20-day exponential moving average ($69,375). If they succeed, the BTC/USDT pair may rally to the breakdown level of $74,508, where the bears are again expected to mount a strong defense.
Sellers will have to successfully defend the 20-day EMA if they want to retain the advantage. If the price turns down sharply from the 20-day EMA, the $60,000 support may be at risk of breaking down. If that happens, the pair may plummet to $52,500.
Ether price prediction
Ether (ETH) turned up from the $1,800 level on Tuesday, indicating that the bulls are attempting to retain the price inside the $1,750 to $2,111 range.
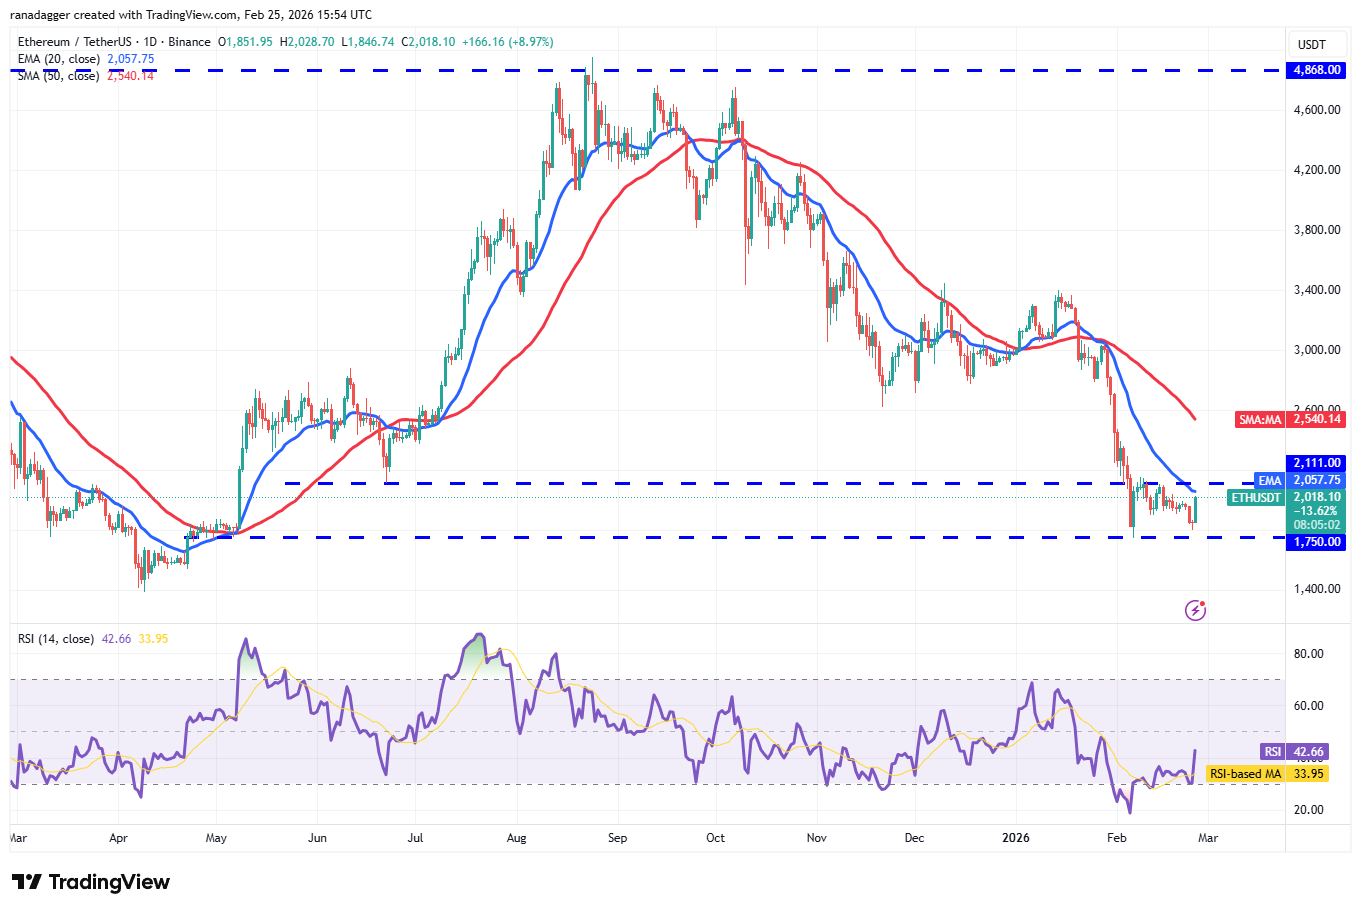
The relief rally is expected to face selling at the $2,111 level. If the Ether price turns down sharply from $2,111, the ETH/USDT pair may extend its stay inside the range for a few more days.
Alternatively, if buyers propel the price above the $2,111 level, it suggests that the bears are losing their grip. The pair may then surge to the 50-day SMA ($2,540), where the bears are again expected to step in.
XRP price prediction
XRP (XRP) turned up sharply and has reached the 20-day EMA ($1.46), indicating that the bulls are attempting a comeback.
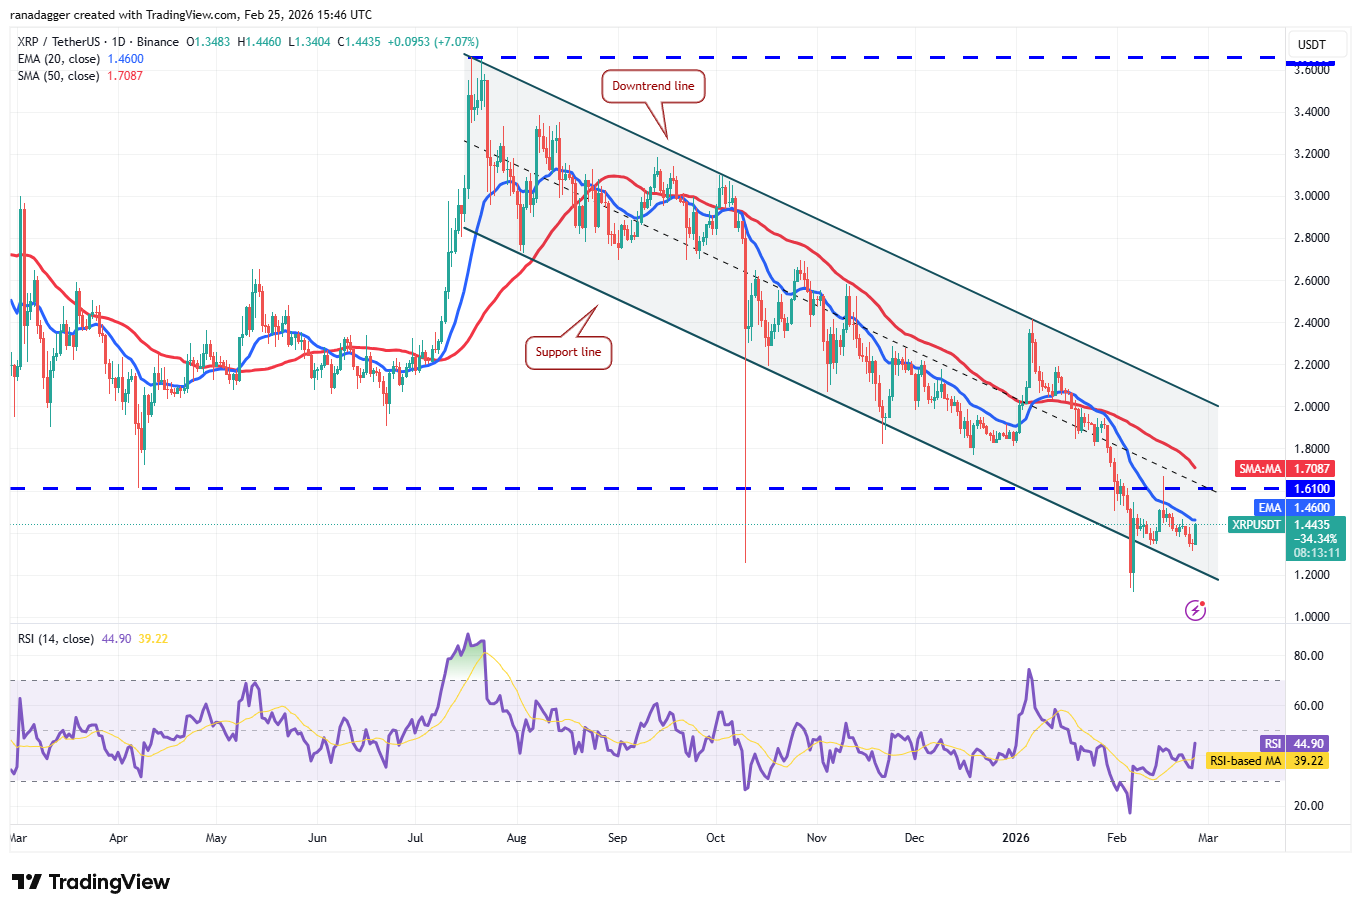
If the XRP price closes above the 20-day EMA, the XRP/USDT pair may rally to the 50-day SMA ($1.70) and eventually to the downtrend line. Buyers will have to clear the hurdle at the downtrend line to signal a potential trend change.
Sellers are likely to have other plans. They will attempt to defend the moving averages and pull the price below the support line. If they can pull it off, the pair may nosedive to the Feb. 6 low of $1.11 and then $1.
BNB price prediction
BNB (BNB) has risen sharply from $577, indicating that the bulls are aggressively defending the $570 level.
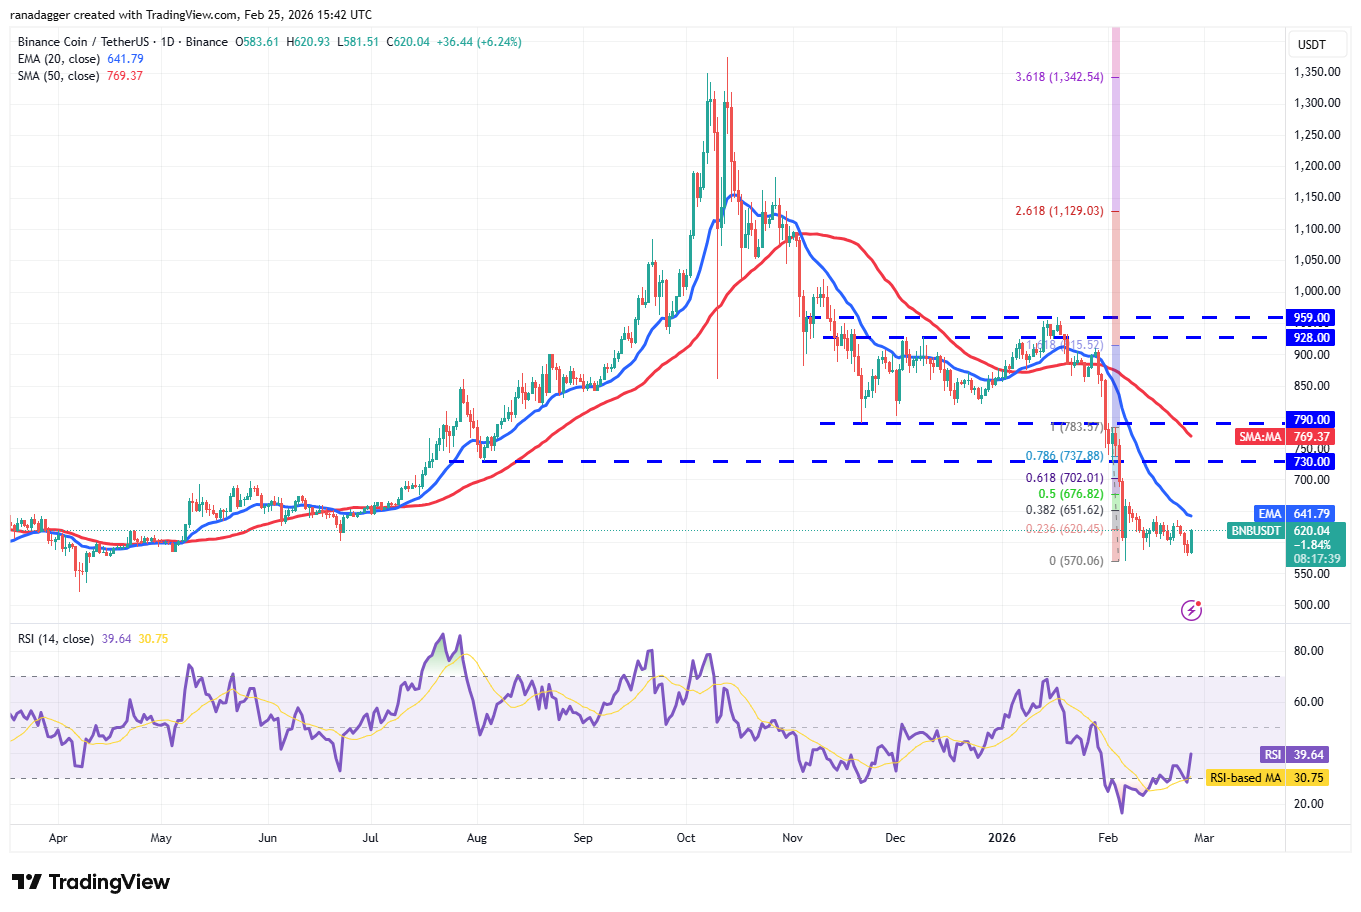
Buyers will have to swiftly drive the price above the 20-day EMA ($641) to strengthen their position. If they manage to do that, the BNB/USDT pair may rise to $669 and eventually to $730.
Contrary to this assumption, if the BNB price turns down and breaks below $570, it indicates that the bears are in control. The pair may then resume the downtrend toward the psychological level at $500.
Solana price prediction
Solana (SOL) dipped below the $76 support on Tuesday, but the bears could not maintain the lower levels.
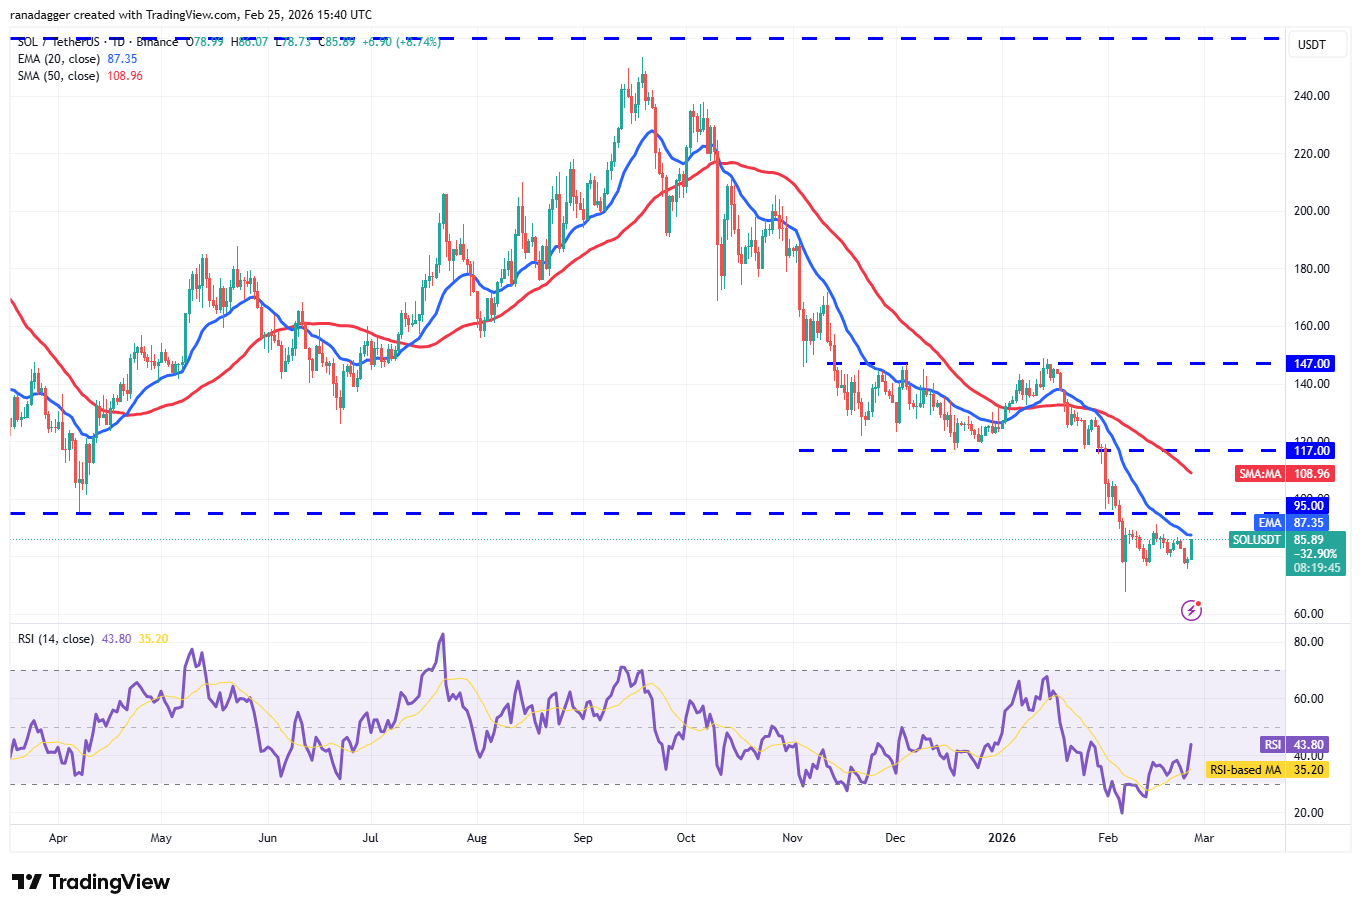
The SOL/USDT pair is attempting a recovery, which is expected to face selling at the 20-day EMA ($87). If the price turns down sharply from the 20-day EMA, the possibility of a break below the $76 level increases. The Solana price may then tumble to the Feb. 6 low of $67.
Instead, if bulls push the price above the 20-day EMA, the relief rally may reach the $95 level. This is a crucial level to watch out for, as a close above $95 suggests that the bulls are back in the game. The pair may then rally toward $117.
Dogecoin price prediction
Dogecoin (DOGE) turned up sharply from the $0.09 level, and the bulls are attempting to drive the price above the 20-day EMA ($0.10).
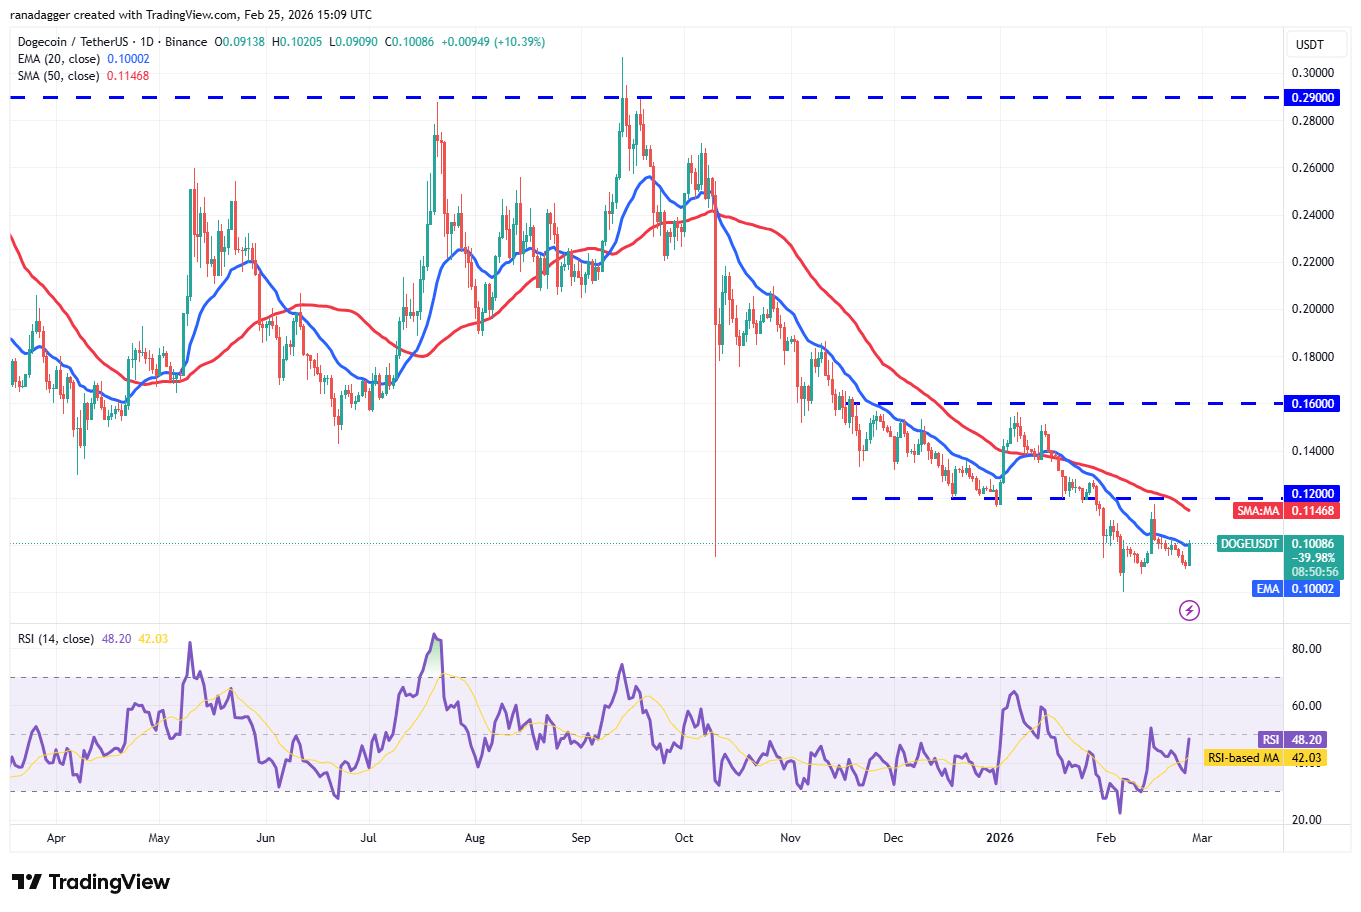
Sellers are unlikely to give up easily and will strive to defend the 20-day EMA. If the Dogecoin price turns down from the 20-day EMA, it increases the likelihood of a drop to the $0.08 support. Buyers are expected to fiercely defend the $0.08 level, as a close below it may start the next leg of the downtrend to the $0.06 level.
Buyers will have to maintain the price above the 20-day EMA to indicate that the bears are losing their grip. The DOGE/USDT pair may then march toward the breakdown level of $0.12.
Bitcoin Cash price prediction
Bitcoin Cash (BCH) turned down sharply from the 50-day SMA ($564) and fell below the $500 support on Monday.
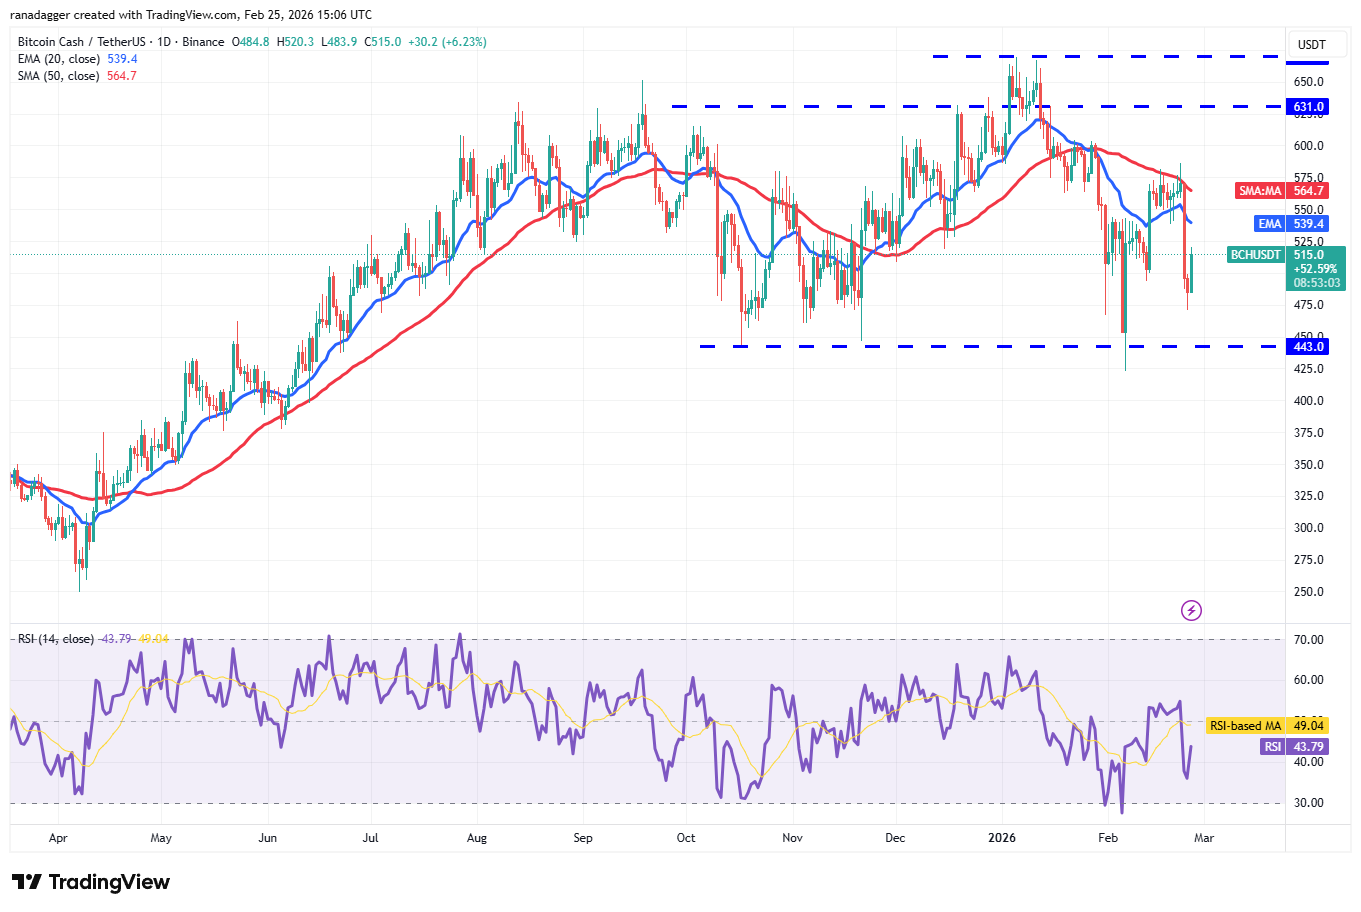
The 20-day EMA has started to turn down, and the RSI is in the negative territory, indicating an advantage to the bears. That suggests the relief rally to the 20-day EMA is likely to be sold into. If the Bitcoin Cash price turns down from the 20-day EMA, the possibility of a drop to the $443 level increases.
The first sign of strength will be a close above the moving averages. The BCH/USDT pair may then rise to $580 and subsequently to $600.
Related: Bitcoin price climbs 3% as gold divergence signals ‘significant upside’
Hyperliquid price prediction
Hyperliquid (HYPE) fell below the 50-day SMA ($28.10) on Monday, indicating that the bears are attempting to take charge.
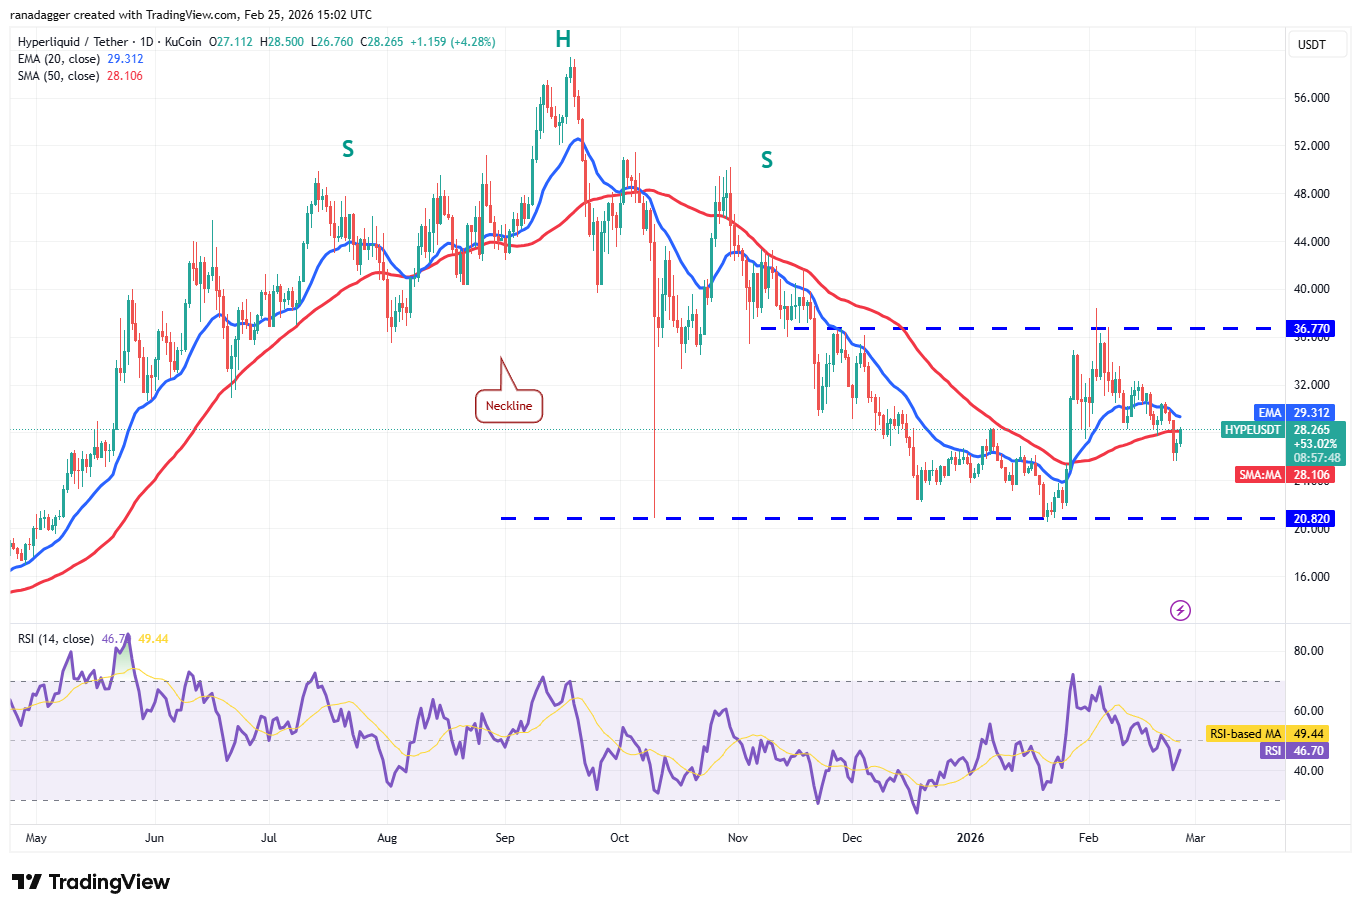
Buyers are striving to push the price back above the moving averages but are likely to face stiff resistance from the bears. If the Hyperliquid price turns down from the moving averages, the HYPE/USDT pair may drop to the solid support at $20.82.
Contrarily, if the price closes above the 20-day EMA ($29.31), it suggests buying at lower levels. The pair may then ascend to $32.50 and later to the stiff resistance at $36.77. The next trending move is expected to begin on a close above $36.77 or below $20.82.
Cardano price prediction
The bears failed to pull Cardano (ADA) to the support line of the descending channel pattern, indicating a lack of selling at lower levels.
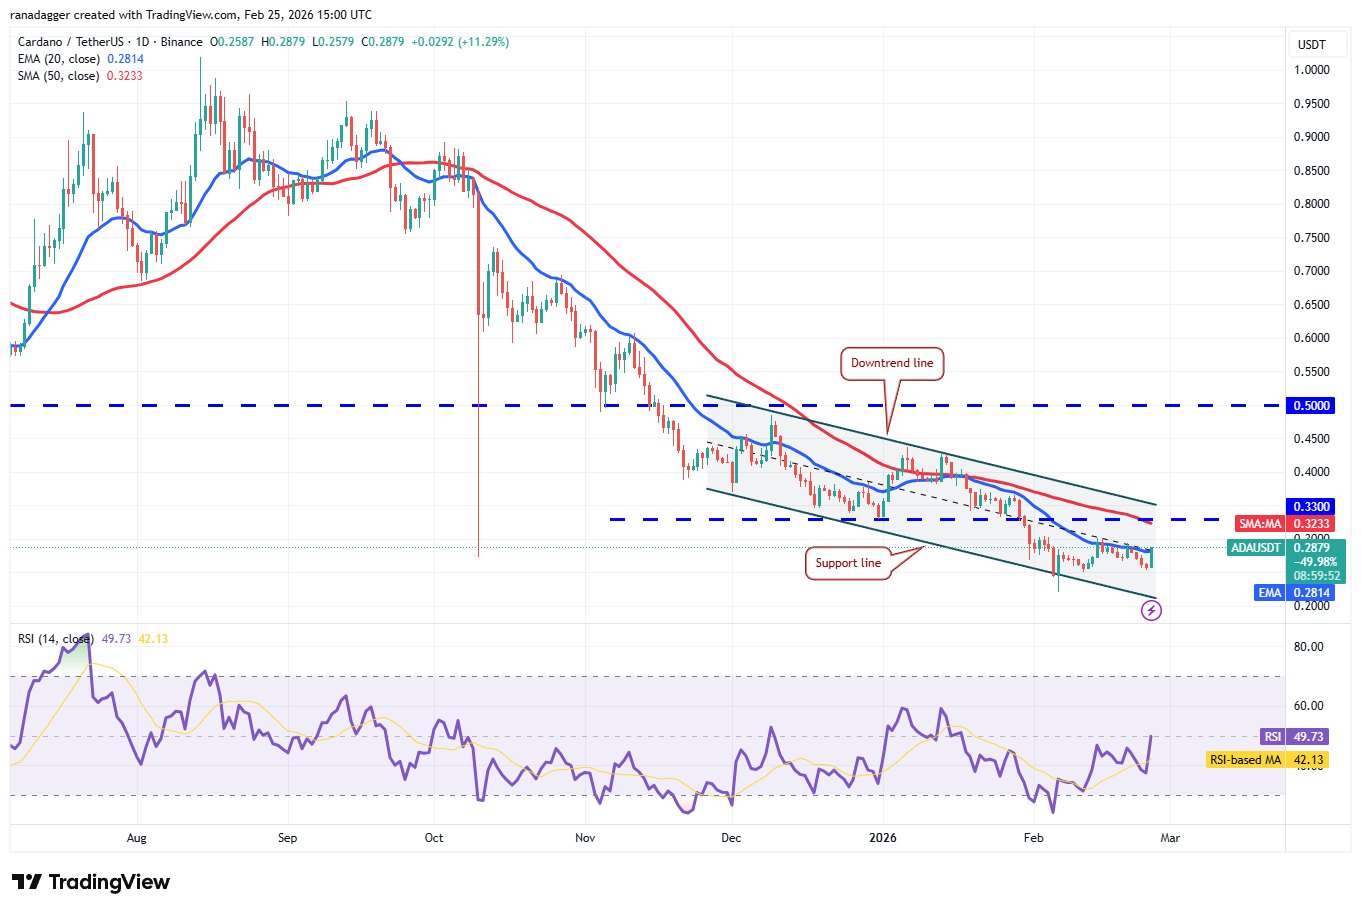
The buyers are attempting to make a comeback by sustaining the Cardano price above the 20-day EMA ($0.28). If they manage to do that, the ADA/USDT pair might rally to the downtrend line.
If the price turns down sharply from the downtrend line and breaks below the 20-day EMA, it suggests that the pair may remain inside the channel for a while. The bulls will have to secure a close above the downtrend line to gain the upper hand.
Monero price prediction
Monero (XMR) fell below the immediate support at $309 on Monday, but the bears could not sustain the lower levels.
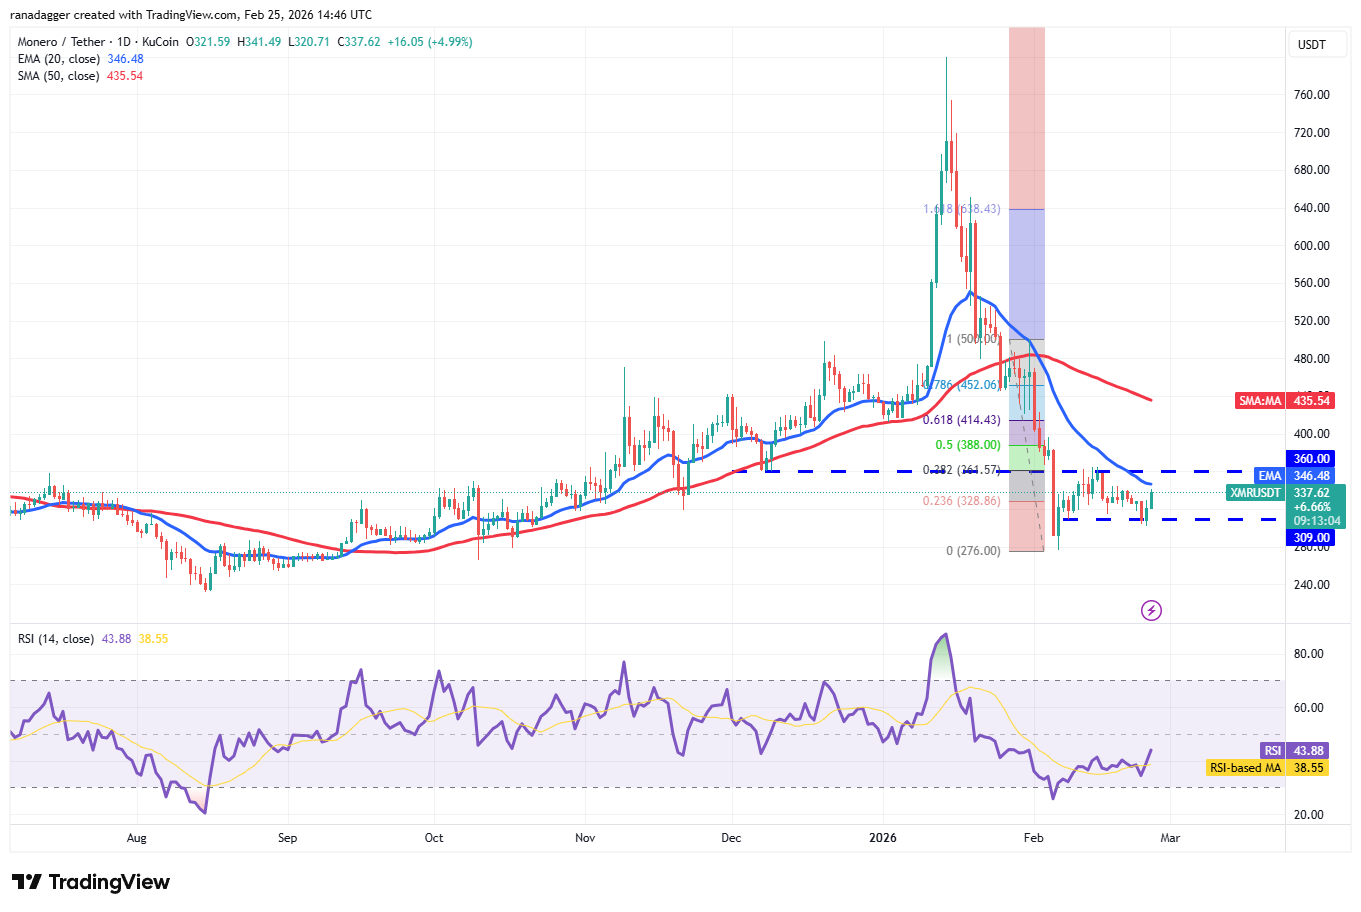
The bulls are attempting a relief rally, which is expected to face selling at the 20-day EMA ($346) and then at the breakdown level of $360. If the Monero price turns down from the overhead resistance, it suggests a range-bound action between $360 and $300 for some time.
The advantage will tilt in favor of the bulls if they push and maintain the XMR/USDT pair above the $360 level. If they do that, the pair may surge toward the 50-day SMA ($435).
This article does not contain investment advice or recommendations. Every investment and trading move involves risk, and readers should conduct their own research when making a decision. While we strive to provide accurate and timely information, Cointelegraph does not guarantee the accuracy, completeness, or reliability of any information in this article. This article may contain forward-looking statements that are subject to risks and uncertainties. Cointelegraph will not be liable for any loss or damage arising from your reliance on this information.
Read the full article here
Fact Checker
Verify the accuracy of this article using AI-powered analysis and real-time sources.