


Listen to the article
Ether (ETH) has fallen by 30% over the past seven days, sliding to $1,900 from $2,800. The drop was accompanied by a sharp decline in futures activity, with Ether’s open interest falling by more than $15 billion over the same period.
Analysts are now focusing on the long-term technical zones and onchain indicators that may signal a major turning point for ETH price.
Key takeaways:
-
Ether has dropped 30% in seven days, slipping below the $2,000 psychological level.
-
Yesterday’s ETH price crash now brings $1,000-$1,400 into focus.
ETH drops with the crypto market
The ETH/USD pair dropped below $2,000 for the first time since May 2025, reaching a nine-month low of $1,740 on Friday. While Ether has since recovered to $1,900 at the time of writing, it has recorded the largest weekly drawdown of 30% among the top-cap cryptocurrencies.
Related: Trend Research dumps over 400K ETH as liquidation risk rises
Bitcoin (BTC), the market leader, was trading at $66,340 at time of writing, down 21% over the last seven days. Fifth-placed XRP (XRP) has lost more than 21% over the last week to trade just above $1.37. Solana (SOL) has also posted significant losses among the top 10 cryptocurrencies, down 29% over the same period.
As a result, the global crypto market capitalization is down 20% over the week toward $2.23 trillion on Friday.
Ether’s slump this week is accompanied by significant long liquidations totaling $400 million over the last 24 hours, signaling intense selling by traders.
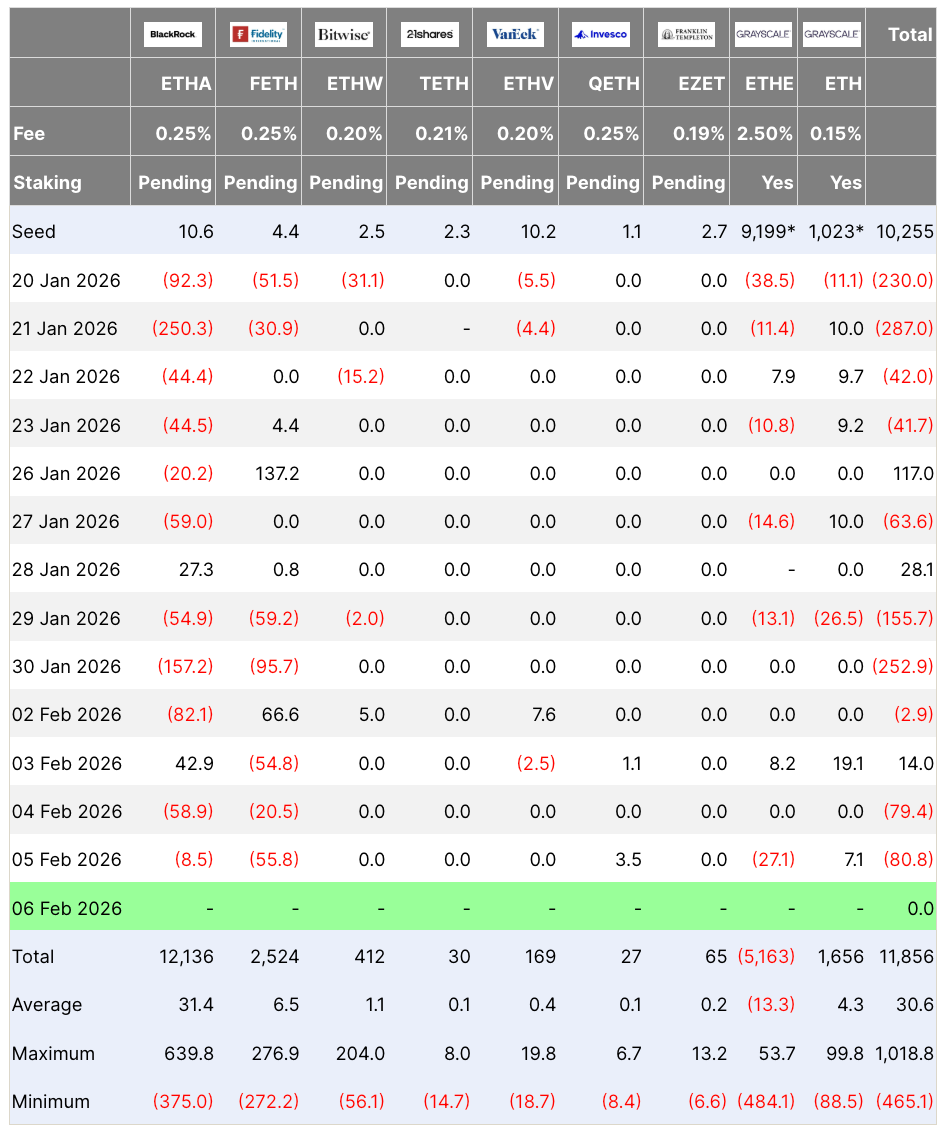
The sellers were also US-based spot Ether ETFs, which have recorded $1.1 billion in net outflows in the past two weeks.
Coupled with increased selling from other major ETH holders such as Trend Research, and Ethereum co-founder Vitalik Buterin, this points to unrelenting overhead pressure that could push ETH price lower.
How low can ETH price go?
Ether’s bearishness over the last two weeks has seen it lose two key support levels, including the 200-week simple moving average (SMA) and the psychological levels at $3,000 and $2,000.
The last time ETH decisively dropped below the 200-week SMA was in March 2025, which was followed by a 45% drop in price.
If history repeats, the ETH/USD pair will extend the downtrend toward $1,400.
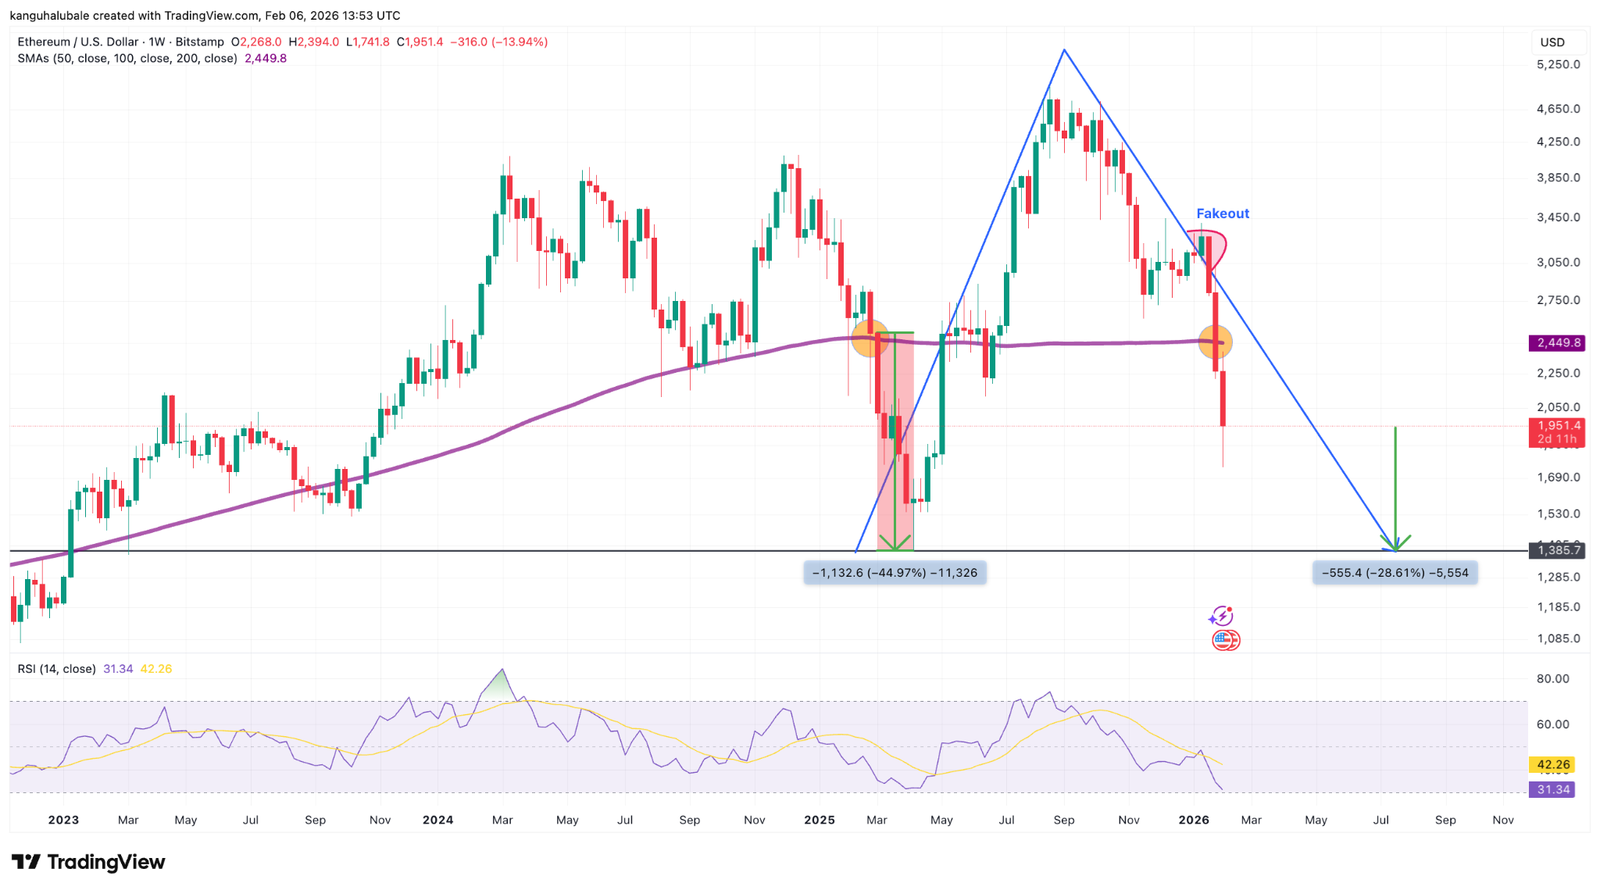
This level aligns with the bearish target of an inverse V-shaped pattern at $1,385, representing a 28% drop from the current price.
As Cointelegraph reported, an inverse cup-and-handle pattern places the downward target at $1,665, while MVRV bands point to a target of $1,725.
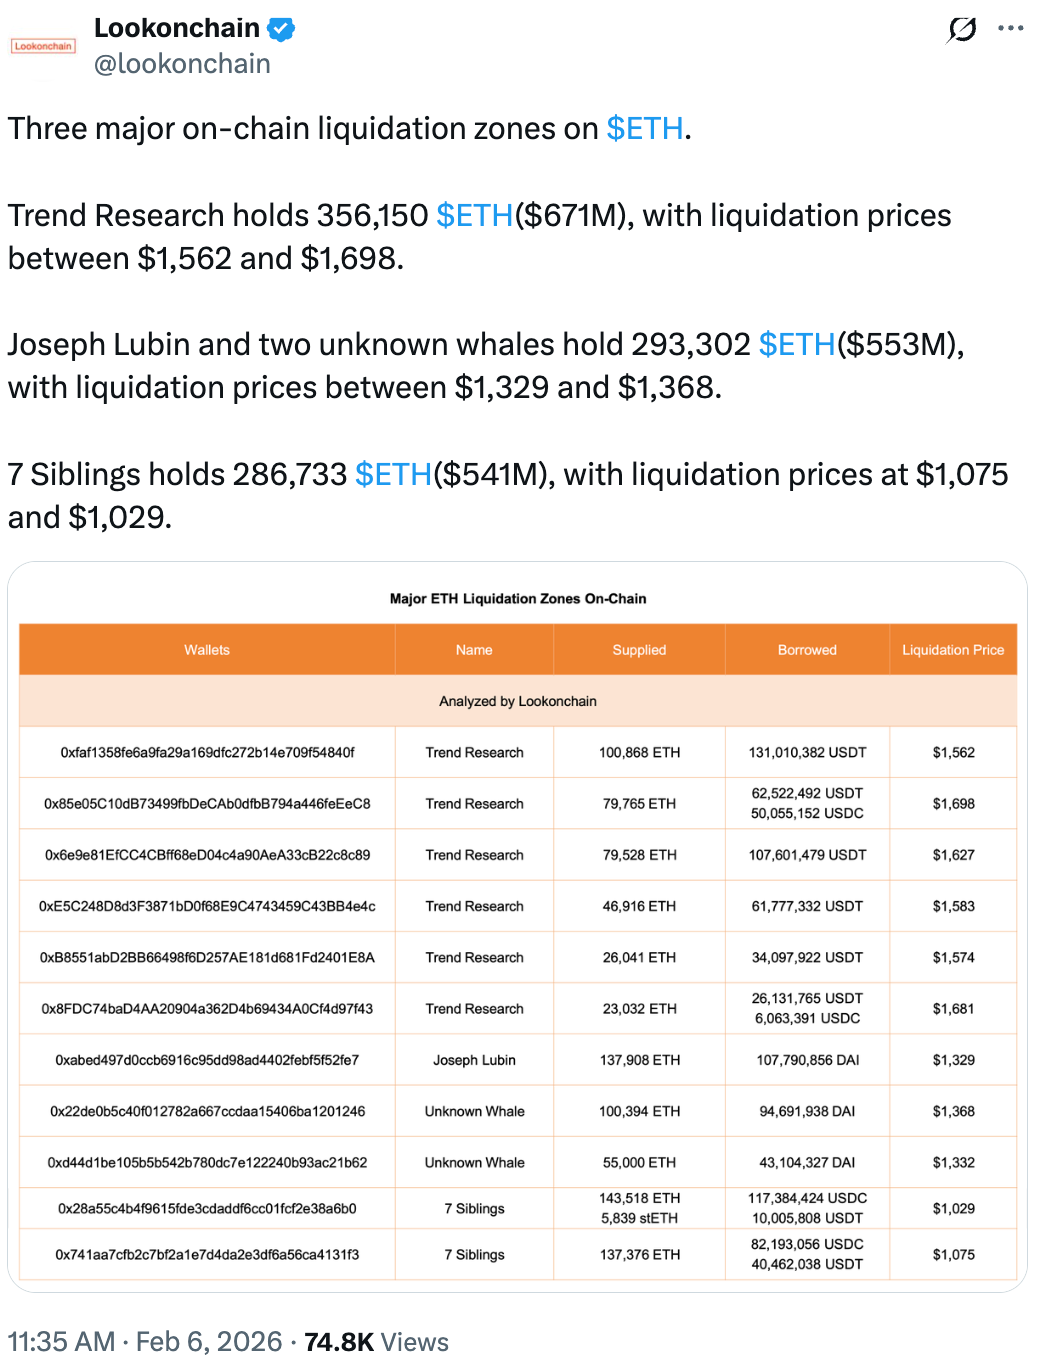
Onchain analytics platform Lookonchain highlighted three major liquidation zones around $1,500, $1,300 and $1,000, which could act as magnets for Ether’s price before a potential bottom.
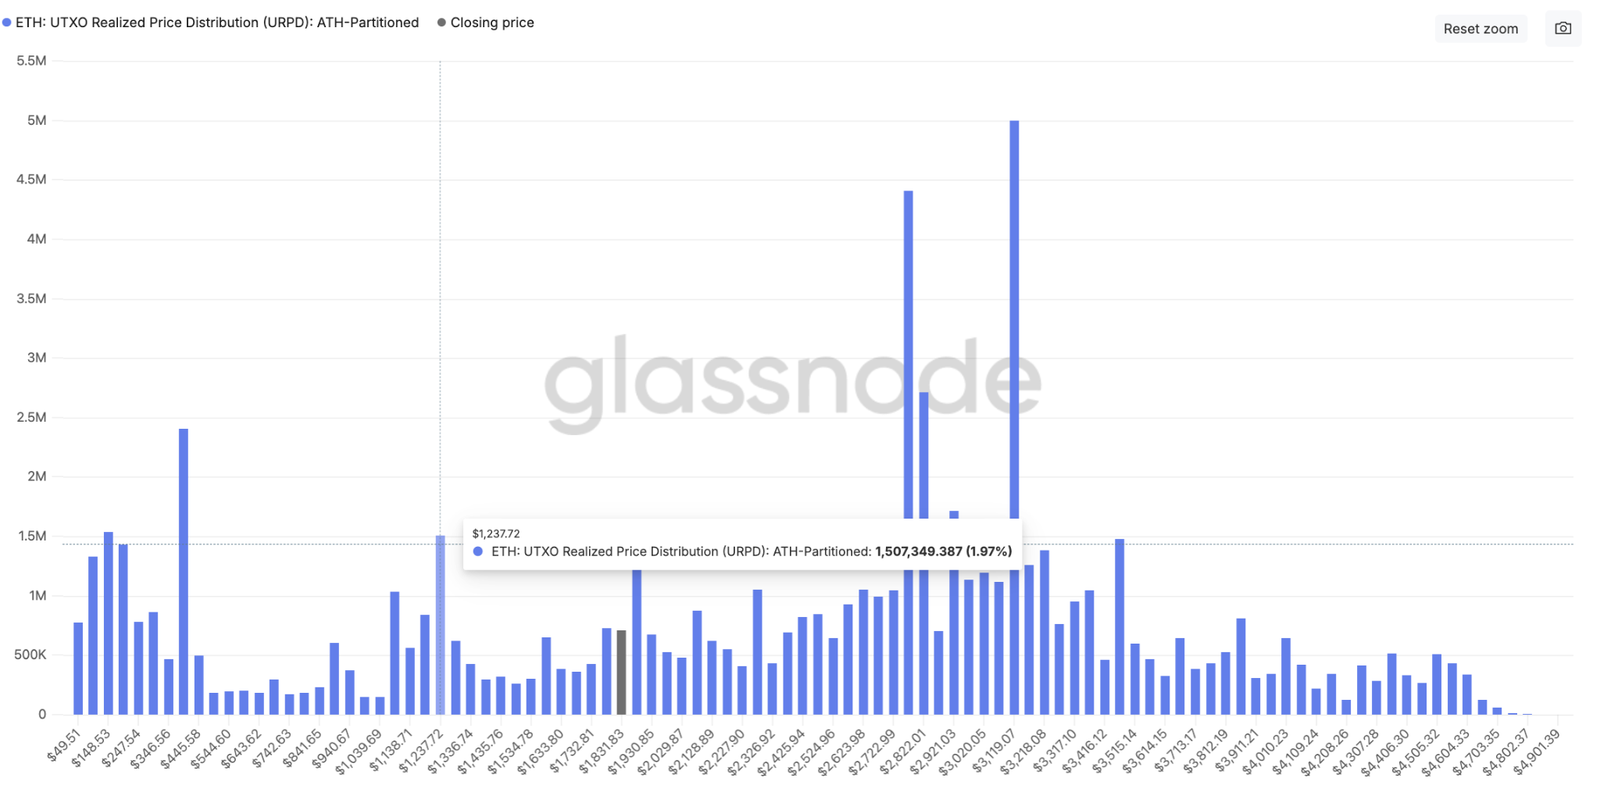
Glassnode’s UTXO realized price distribution (URPD), showing the average prices at which SOL holders bought their coins, reveals that there is little previous volume below $1,900. In other words, buyers might not step in before the price drops to the aforementioned support levels.
The next significant support sits at $1,200, where approximately 1.5 million ETH were previously acquired.
This article does not contain investment advice or recommendations. Every investment and trading move involves risk, and readers should conduct their own research when making a decision. While we strive to provide accurate and timely information, Cointelegraph does not guarantee the accuracy, completeness, or reliability of any information in this article. This article may contain forward-looking statements that are subject to risks and uncertainties. Cointelegraph will not be liable for any loss or damage arising from your reliance on this information.
Read the full article here
Fact Checker
Verify the accuracy of this article using AI-powered analysis and real-time sources.