


Listen to the article
Key points:
-
Bitcoin seals its worst October performance since 2018 as traders flip cautious on the outlook.
-
ETF outflows return as derivatives traders hedge risk despite macro tailwinds.
-
Bollinger Bands data suggests that BTC price volatility is due to make a sweeping comeback.
Bitcoin (BTC) traded around $110,000 on Saturday as traders stayed bearish after “Uptober” failed to deliver.
Bitcoin demand “weakness” closes out Uptober
Data from Cointelegraph Markets Pro and TradingView showed that the BTC price was recovering losses from Friday’s Wall Street trading session.
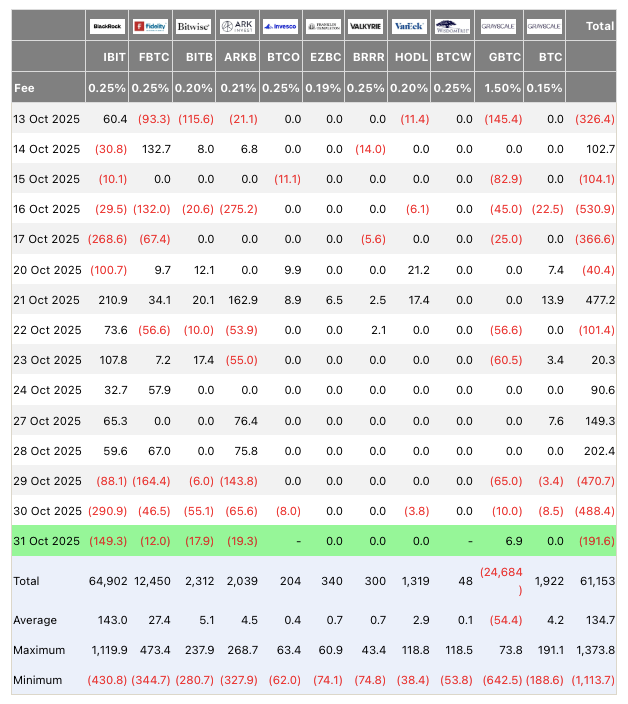
This began with sell pressure — a frequent phenomenon throughout the week — involving both US exchanges and the spot Bitcoin exchange-traded funds (ETFs).
Onchain analytics platform Glassnode said that ETF outflows highlight “rising sell pressure from TradFi investors and renewed weakness in institutional demand.”
Data from UK-based investment company Farside Investors put Friday’s tally at $191 million, which followed $488 million in outflows for Thursday.
Continuing, Glassnode noted that markets had shrugged off a macro tailwind in the form of an interest-rate cut from the US Federal Reserve.
The Fed delivered the expected rate cut, but the hawkish tone for December has cooled optimism,” it told X followers.
“The initial rally faded as traders moved back into cautious mode, a shift clearly reflected in BTC’s options market.”
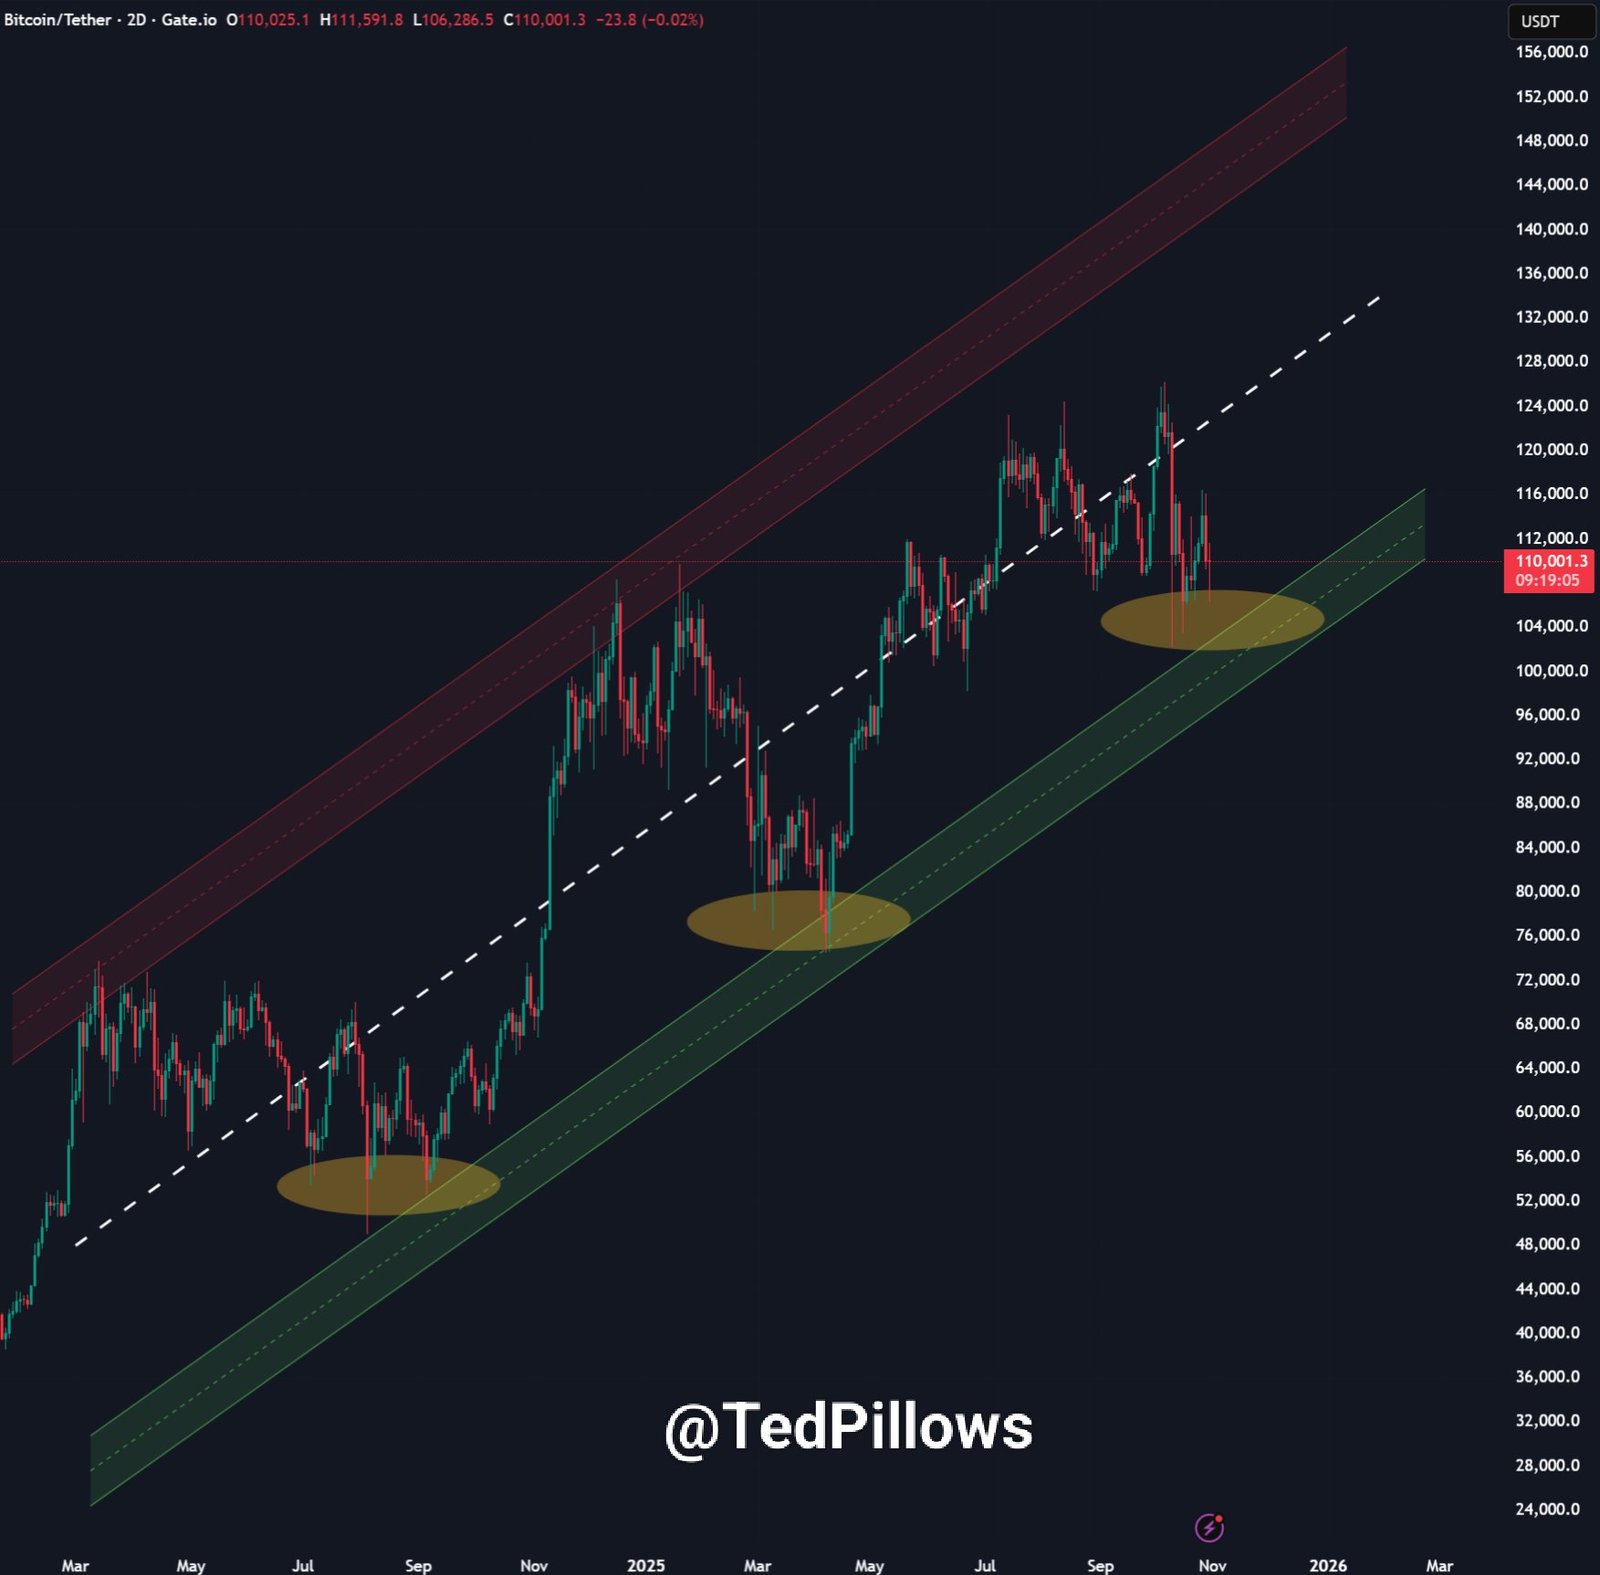
Traders likewise remained cautious, with crypto investor and entrepreneur Ted Pillows calling the current setup on Bitcoin “time-based capitulation.”
“BTC time-based capitulation is happening now. But for this, Bitcoin needs to consolidate above $100,000,” he warned Friday.
“A weekly close below this level will confirm the downtrend.”
Trader Daan Crypto Trades, meanwhile, said that a true move could only come once BTC price decisively crossed the upper or lower boundary of its local range. The two key levels of interest were $107,000 and $116,000.
$BTC Held $107K again and moved back to the mid range. It’s just up one day, down the other at this point.
Range is ranging. Chop is chopping.
We remain patient for $107K or $116K to break to see some momentum back into this market and for the range to end. https://t.co/c7zhiRd92f pic.twitter.com/u8PpwzaDLn
— Daan Crypto Trades (@DaanCrypto) October 31, 2025
Bollinger Bands say BTC price volatility next
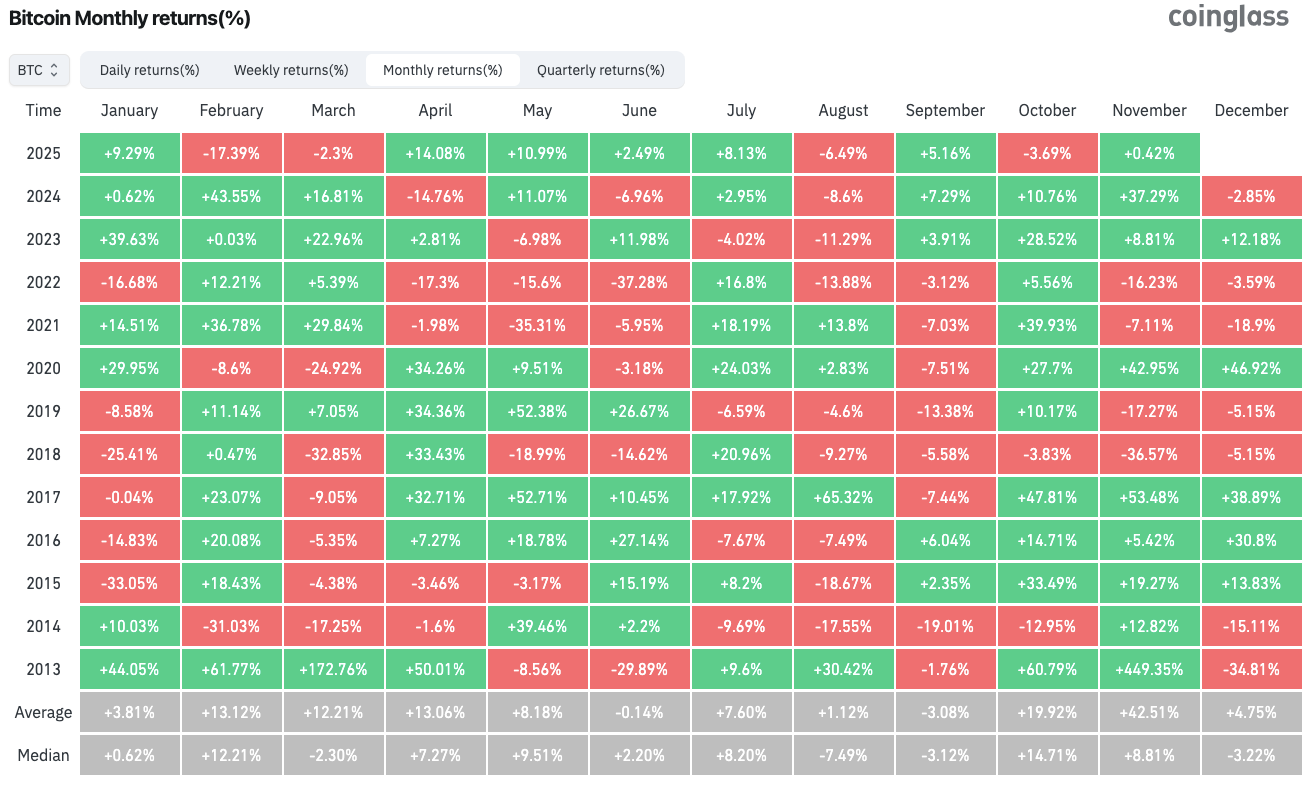
The October monthly candle thus delivered a disappointing 3.7% loss for BTC/USD — the worst result since 2018.
Related: Bitcoin set for first red October in seven years: What will November bring?
As Cointelegraph reported, November is traditionally Bitcoin’s best-performing month, with data from CoinGlass confirming an average upside of a giant 42.5% since 2013.
Discussing the topic, commentator Matthew Hyland added that the Bollinger Bands volatility indicator continued to imply record volatility was on the way.
“Monthly Bollinger Bands have reached the most extreme levels in Bitcoin’s entire history,” he wrote on X.
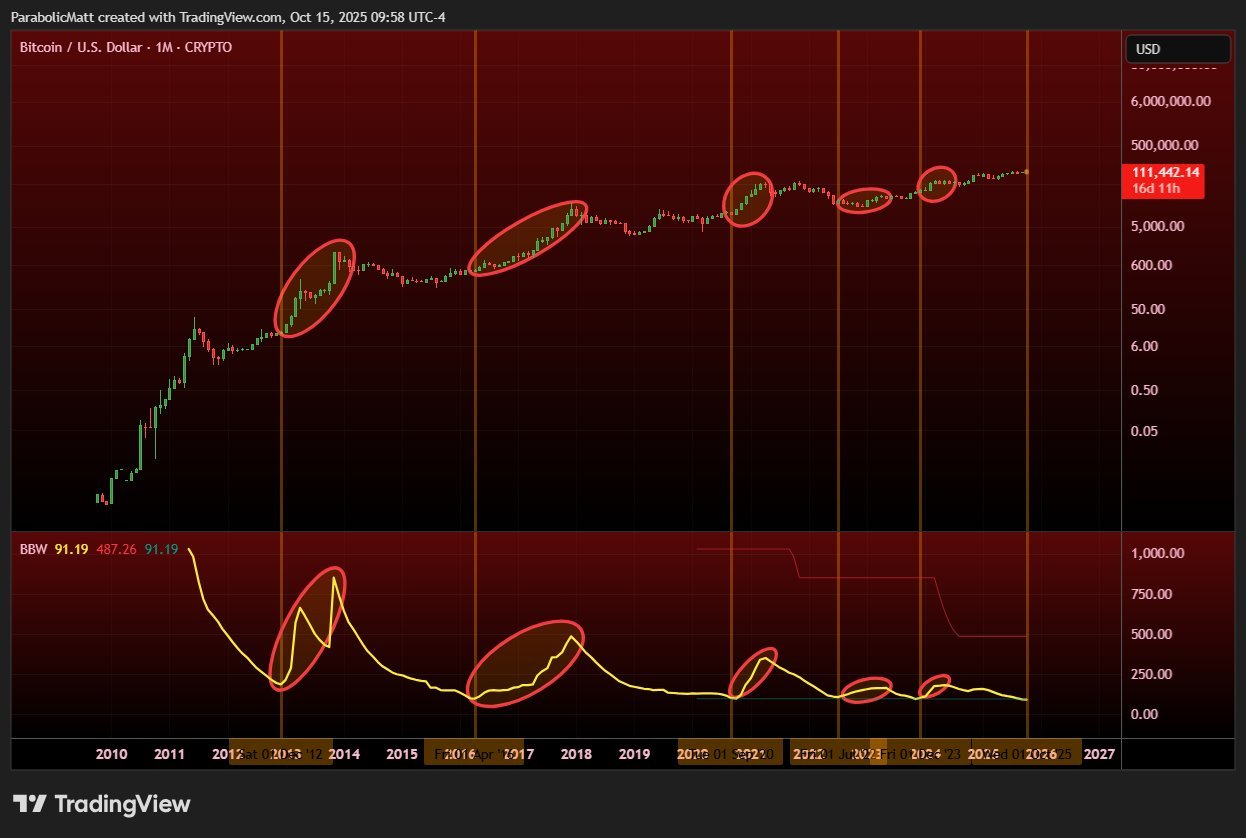
Bollinger Band narrowing has long been on the radar for market participants.
Last month, the indicator’s creator, John Bollinger, said that it would soon be “time to pay attention” to volatility on both Bitcoin and major altcoins.
This article does not contain investment advice or recommendations. Every investment and trading move involves risk, and readers should conduct their own research when making a decision.
Read the full article here
Fact Checker
Verify the accuracy of this article using AI-powered analysis and real-time sources.