


Listen to the article
Bitcoin (BTC) is trading within a bear flag pattern that projects a breakdown toward the sub-$50,000 area, or roughly 30% below current levels. However, Michael Saylor’s Strategy could spoil the bears’ plans.
Key takeaways:
-
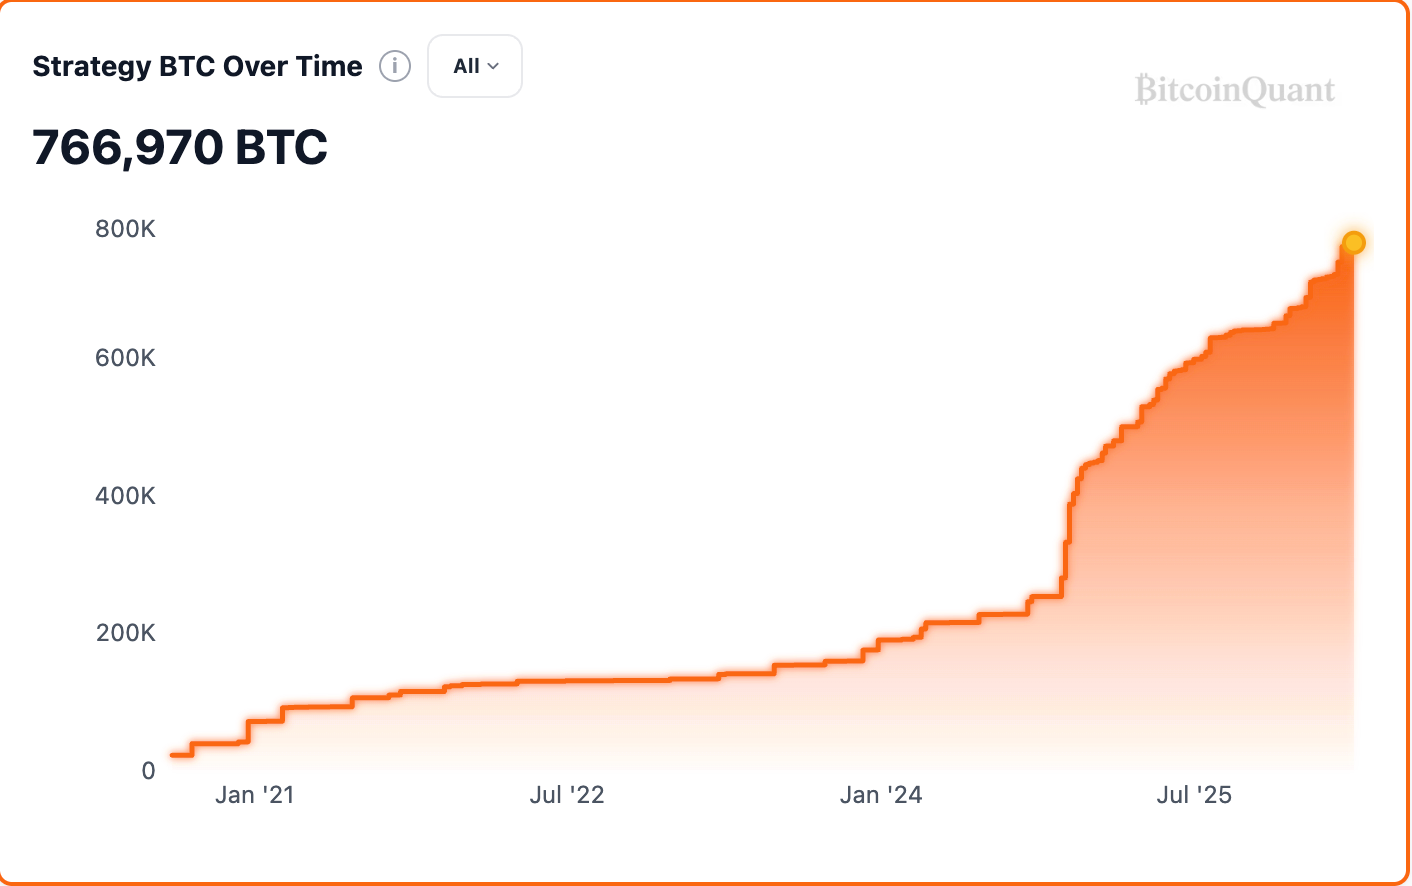
Bitcoin has avoided a bear flag breakdown for weeks as Strategy keeps buying BTC.
-
The setup now resembles Bitcoin’s 2018 bottom, when a bearish pattern failed and triggered a reversal.
Can Strategy’s BTC buying offset weak technicals?
Normally, a bear flag remains a bearish continuation pattern because there is not enough demand to overcome the broader downtrend.
In Bitcoin’s case, however, Strategy has been taking supply off the market faster than miners can replace it.
Since March 2, Strategy’s Bitcoin holdings have risen by 46,233 BTC, while miners have produced only about 16,200 BTC over the same period, meaning it has absorbed nearly thrice the new supply.
Much of that demand has come through STRC, Strategy’s variable-rate preferred stock. When STRC held near or above its $100 par value, Strategy kept issuing shares and accumulating BTC.
For instance, last week, Strategy raised $102.6 million through STRC sales to help fund a Bitcoin purchase worth over $330 million. BTC’s price has jumped by over 6.65% ever since.
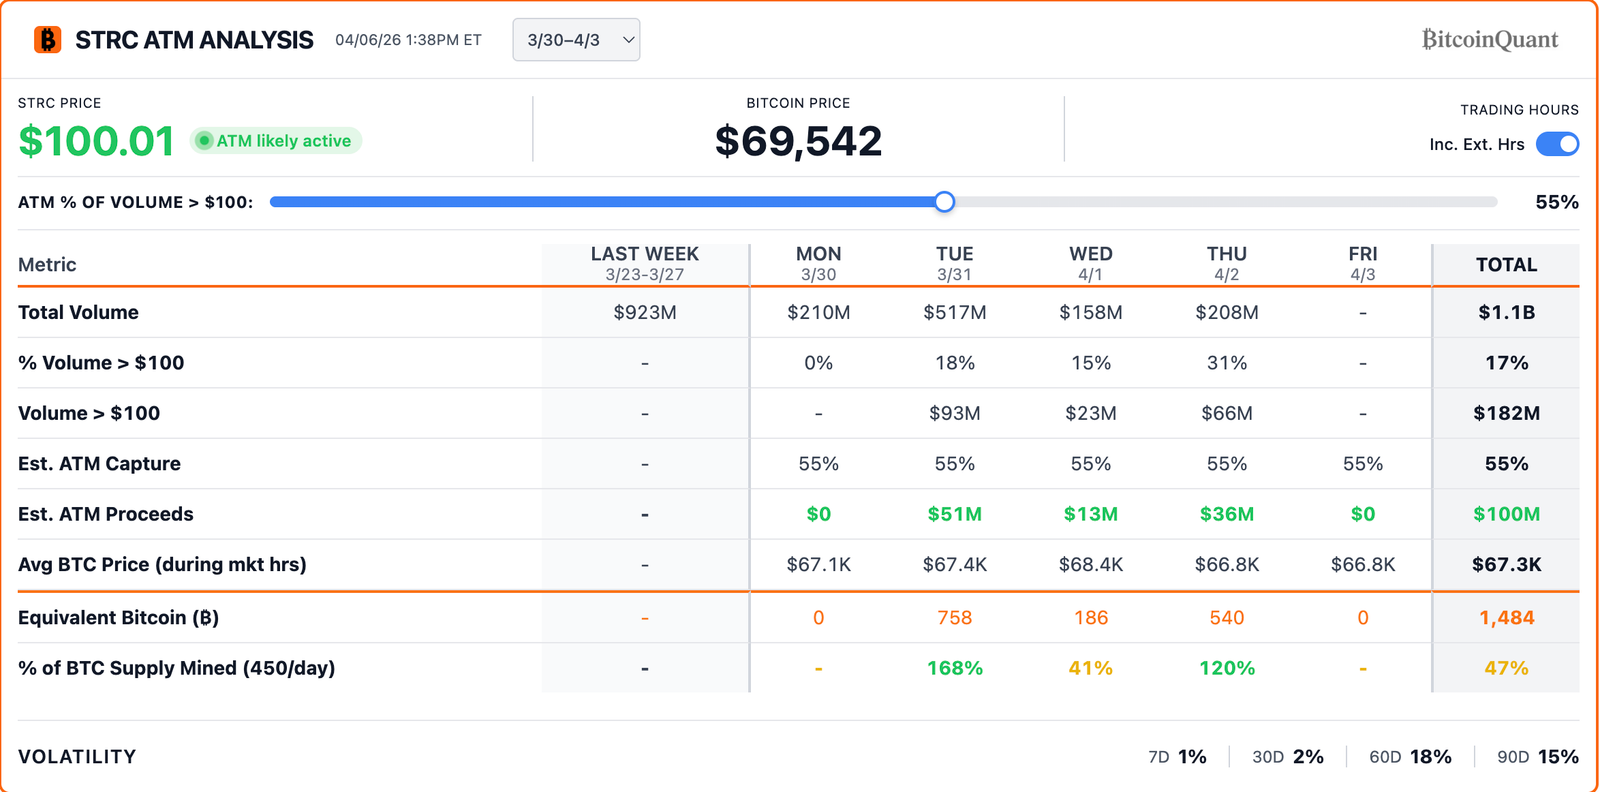
During March 9–13, STRC sales raised about $776 million, enough to buy over 11,000 BTC, while Bitcoin rose more than 7% even as the S&P 500 fell 1.6%. The same period saw BTC’s price rising over 10.5%.
But when STRC slipped below par in mid-March, issuance slowed. Earlier below-par episodes had coincided with 25%–40% BTC pullbacks, including a nearly 40% drop over three weeks after a January pause.
Bitcoin’s long-term holders and whales drove much of the selling.
Bear flag failure could set stage for rally to $110,000
Bitcoin remains inside a bear flag after a sharp decline, but the pattern would begin to fail if price breaks above the upper trendline near the mid-$70,000 area.
That breakout would invalidate the immediate bearish continuation setup and shift focus to the bullish measured-move target near $108,000-$110,000.
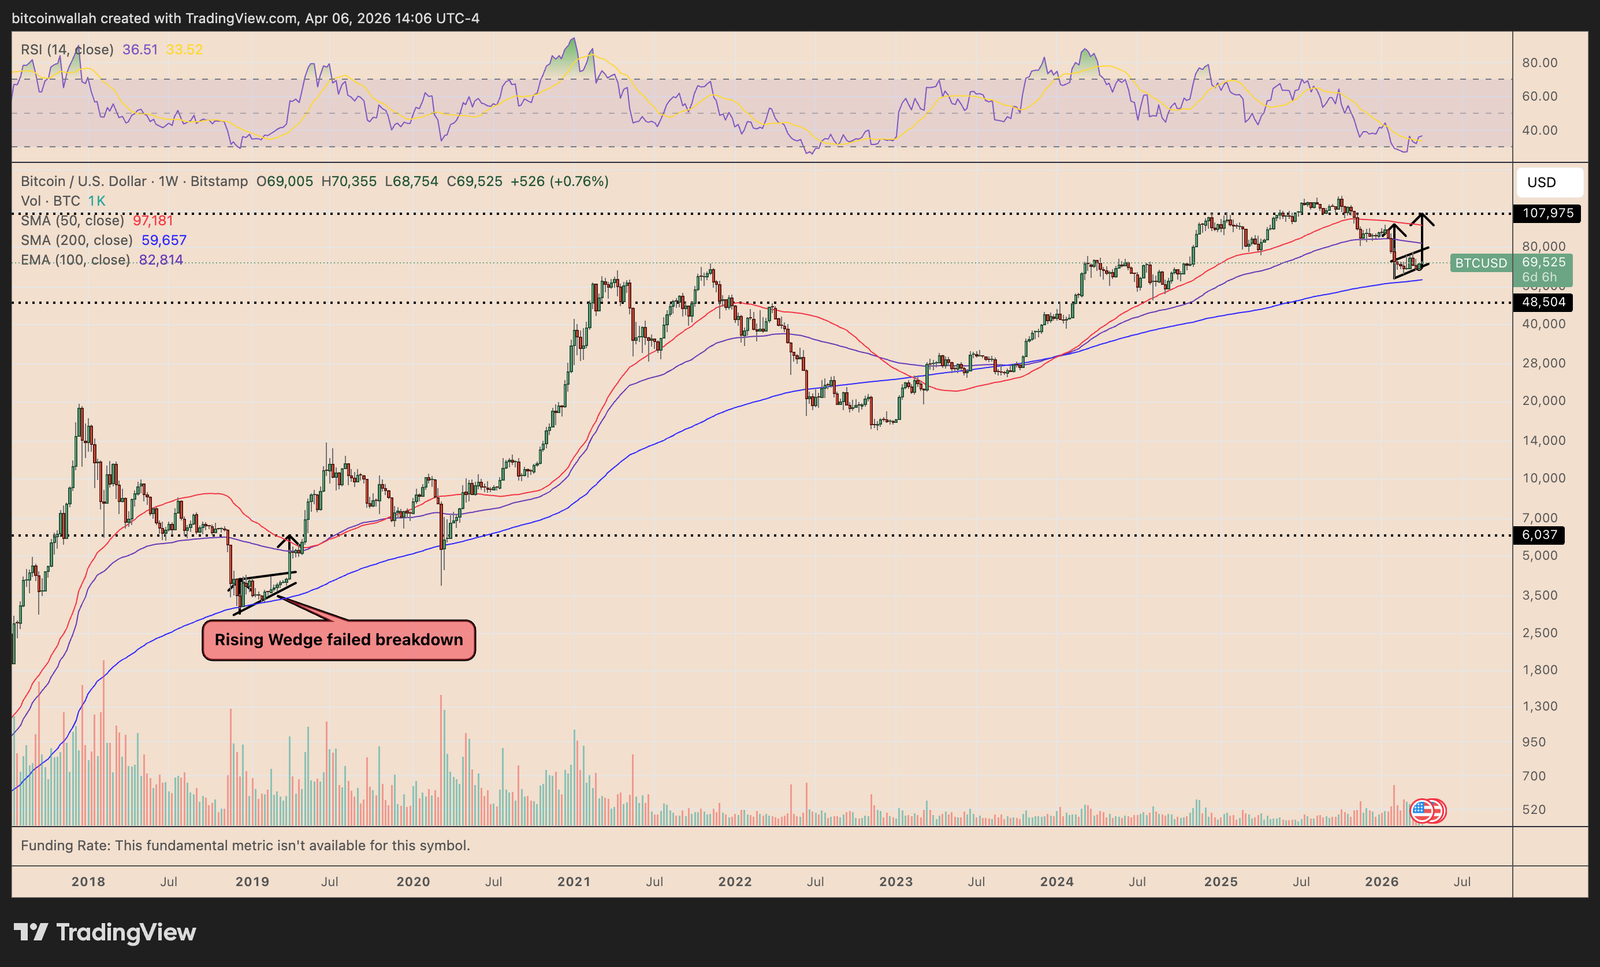
A similar pattern failure occurred near Bitcoin’s 2018 bottom, when a rising wedge pattern led to a breakout instead of a breakdown.
Another factor supporting the upside case is Bitcoin’s position near its 200-week simple moving average (200-week SMA, the blue wave). In 2018, Bitcoin bottomed out near this level and rose by over 1,975% afterward.
As of 2026, the 200-week SMA has capped Bitcoin’s downside attempts successfully, raising the odds of a 2018-like bottom formation.
Related: Strategy’s STRC stock trading surge: How much Bitcoin can Saylor buy?
Some analysts anticipate BTC to rise to $400,000 if Strategy continues buying BTC at its current rate.
This article is produced in accordance with Cointelegraph’s Editorial Policy and is intended for informational purposes only. It does not constitute investment advice or recommendations. All investments and trades carry risk; readers are encouraged to conduct independent research before making any decisions. Cointelegraph makes no guarantees regarding the accuracy or completeness of the information presented, including forward-looking statements, and will not be liable for any loss or damage arising from reliance on this content.
Read the full article here
Fact Checker
Verify the accuracy of this article using AI-powered analysis and real-time sources.