


Listen to the article
Key Takeaways
Playback Speed
Select a Voice
In brief
- Bitcoin falls deeper into a death cross, a technical pattern that usually signals a bear market trend.
- XRP has likewise formed a death cross pattern on its chart, and Ethereum is close to doing the same.
- With the crypto market tumbling, signs point to further downside to come.
Bitcoin bags are getting blown out today, as the price of BTC falls to nearly $80,000 and marks a new seven-month low.
The continued downward pressure on its price has pushed Bitcoin into a so-called death cross—when the average price of an asset over the short term falls below the average price over the long term. It’s a technical pattern that typically signals extended bearish momentum. For traders who study charts, it confirms what permabulls don’t want to hear: It’s over—at least for now.
It’s happening as the crypto market as a whole shrinks to $2.91 trillion, shedding nearly $60 billion in the past 24 hours alone. Almost every single coin in the top 100 by market cap is bleeding red.
The Fear and Greed Index, which measures market sentiment on a scale from 0 to 100, has cratered to 14 points—just four points above the year’s low of 10 back in February. When this index drops below 20, it signals “extreme fear,” and right now, traders are absolutely terrified.
But it’s not just crypto drama driving the market selloff. The macro picture is turning nasty. Just weeks ago, markets were pricing in a 97% chance the Federal Reserve would cut interest rates in December. Now? Those odds have collapsed to somewhere between 22% and 43%, depending on which metric you check.
Fed officials are openly divided, with many signaling they’d prefer to keep rates unchanged through year-end. For risk assets like crypto that thrive on easy money, this is poison.
On Myriad, a prediction market developed by Decrypt’s parent company Dastan, traders are now overwhelmingly convinced that Bitcoin will not mark a new all-time high this year, placing odds at almost 90% that BTC will not top the $126K mark that it hit on October 6.
The bearish vibes are so strong, Myriad traders also currently place 40% odds that Bitcoin falls as low as $69K. So how low will it go? Here’s what the charts say.
Bitcoin (BTC) price: Death cross in place, and bears in control
Bitcoin opened today at $86,691 and immediately sold off, hitting an intraday low of $80,620 before bouncing slightly to its current price at $85,187. That’s a 1.61% drop on the day after being almost 5% down over the last 24 hours. More importantly, for traders, it further confirms the death cross pattern that’s been progressively forming since its all-time high in early October. The death cross pattern was first confirmed on Wednesday as Bitcoin slid to around $88,000—now it’s fallen deeper.
Here’s what’s happening on the charts: Exponential Moving Averages, or EMAs, help traders identify trend direction by tracking the average price of an asset over the short, medium, and long term. When the short-term 50-day EMA falls below the longer-term 200-day EMA, it means bears are in control and the longer-term bull market structure has been broken.
For Bitcoin, the 50-day EMA has now decisively crossed below the 200-day EMA. In short, this tells traders market momentum has shifted from bullish to bearish. The gap between both EMAs increases the more the price of BTC trades below those targets—and the bigger the gap, the stronger the trend.
The price of Bitcoin is now trading well below both EMAs, which creates a situation where each bounce attempt faces immediate resistance, increasing the gap between the two EMAs, making the bearish trend even stronger. Bulls trying to push higher will need to first reclaim the 50-day EMA, then tackle the 200-day—a double wall of resistance that’s historically tough to crack in one go.
As for other technical indicators, the Average Directional Index, or ADX, sits at 41, which is considered “strong.” ADX measures trend strength regardless of direction, with readings above 25 indicating a clear trend is in place. At 41, this tells us we’re not seeing just a minor correction, but a potentially extended move lower.
The Relative Strength Index, or RSI, has plunged to 23.18, placing Bitcoin deep in oversold territory. RSI measures momentum on a scale from 0 to 100, with readings below 30 signaling oversold conditions where assets are potentially undervalued. However, “oversold” doesn’t mean the selling has to stop—in strong downtrends, RSI can remain in oversold territory for extended periods as prices continue grinding lower. But, yes, this also provides hopium for momentum traders as it signals that the worst of it may be over. (The worst being an accelerated crash, not necessarily a steady drop.)
The Squeeze Momentum Indicator is flashing “bearish impulse,” meaning selling pressure is intensifying rather than easing. Meanwhile, the Volume Profile Visible Range (VPVP) shows the price of Bitcoin trading “below” key volume nodes, suggesting there’s not much buying interest at current levels.
So, everything is bearish, clearly. But where’s the next support? How low can the price of BTC go? The chart reveals several key horizontal levels to watch.
The immediate danger zone is $80,697, which briefly held today but looked shaky. If that breaks, the next major support sits at $74,555, followed by $65,727, and potentially all the way down to $53,059 if panic really sets in during a crypto winter. Those price levels have previous consolidation zones where significant trading volume accumulated, making them natural landing spots for oversold bounces.
For resistances, traders will watch for BTC’s price breaking past $90,000 again and look at $100,000 as the major psychological target.
Ethereum (ETH) price: Hanging by a thread
Ethereum opened at $2,830.7 and dropped as low as $2,621 intraday before stabilizing around $2,798—a 1.16% loss on the day. While not as dramatic as Bitcoin’s selloff, ETH’s technical picture is equally concerning.
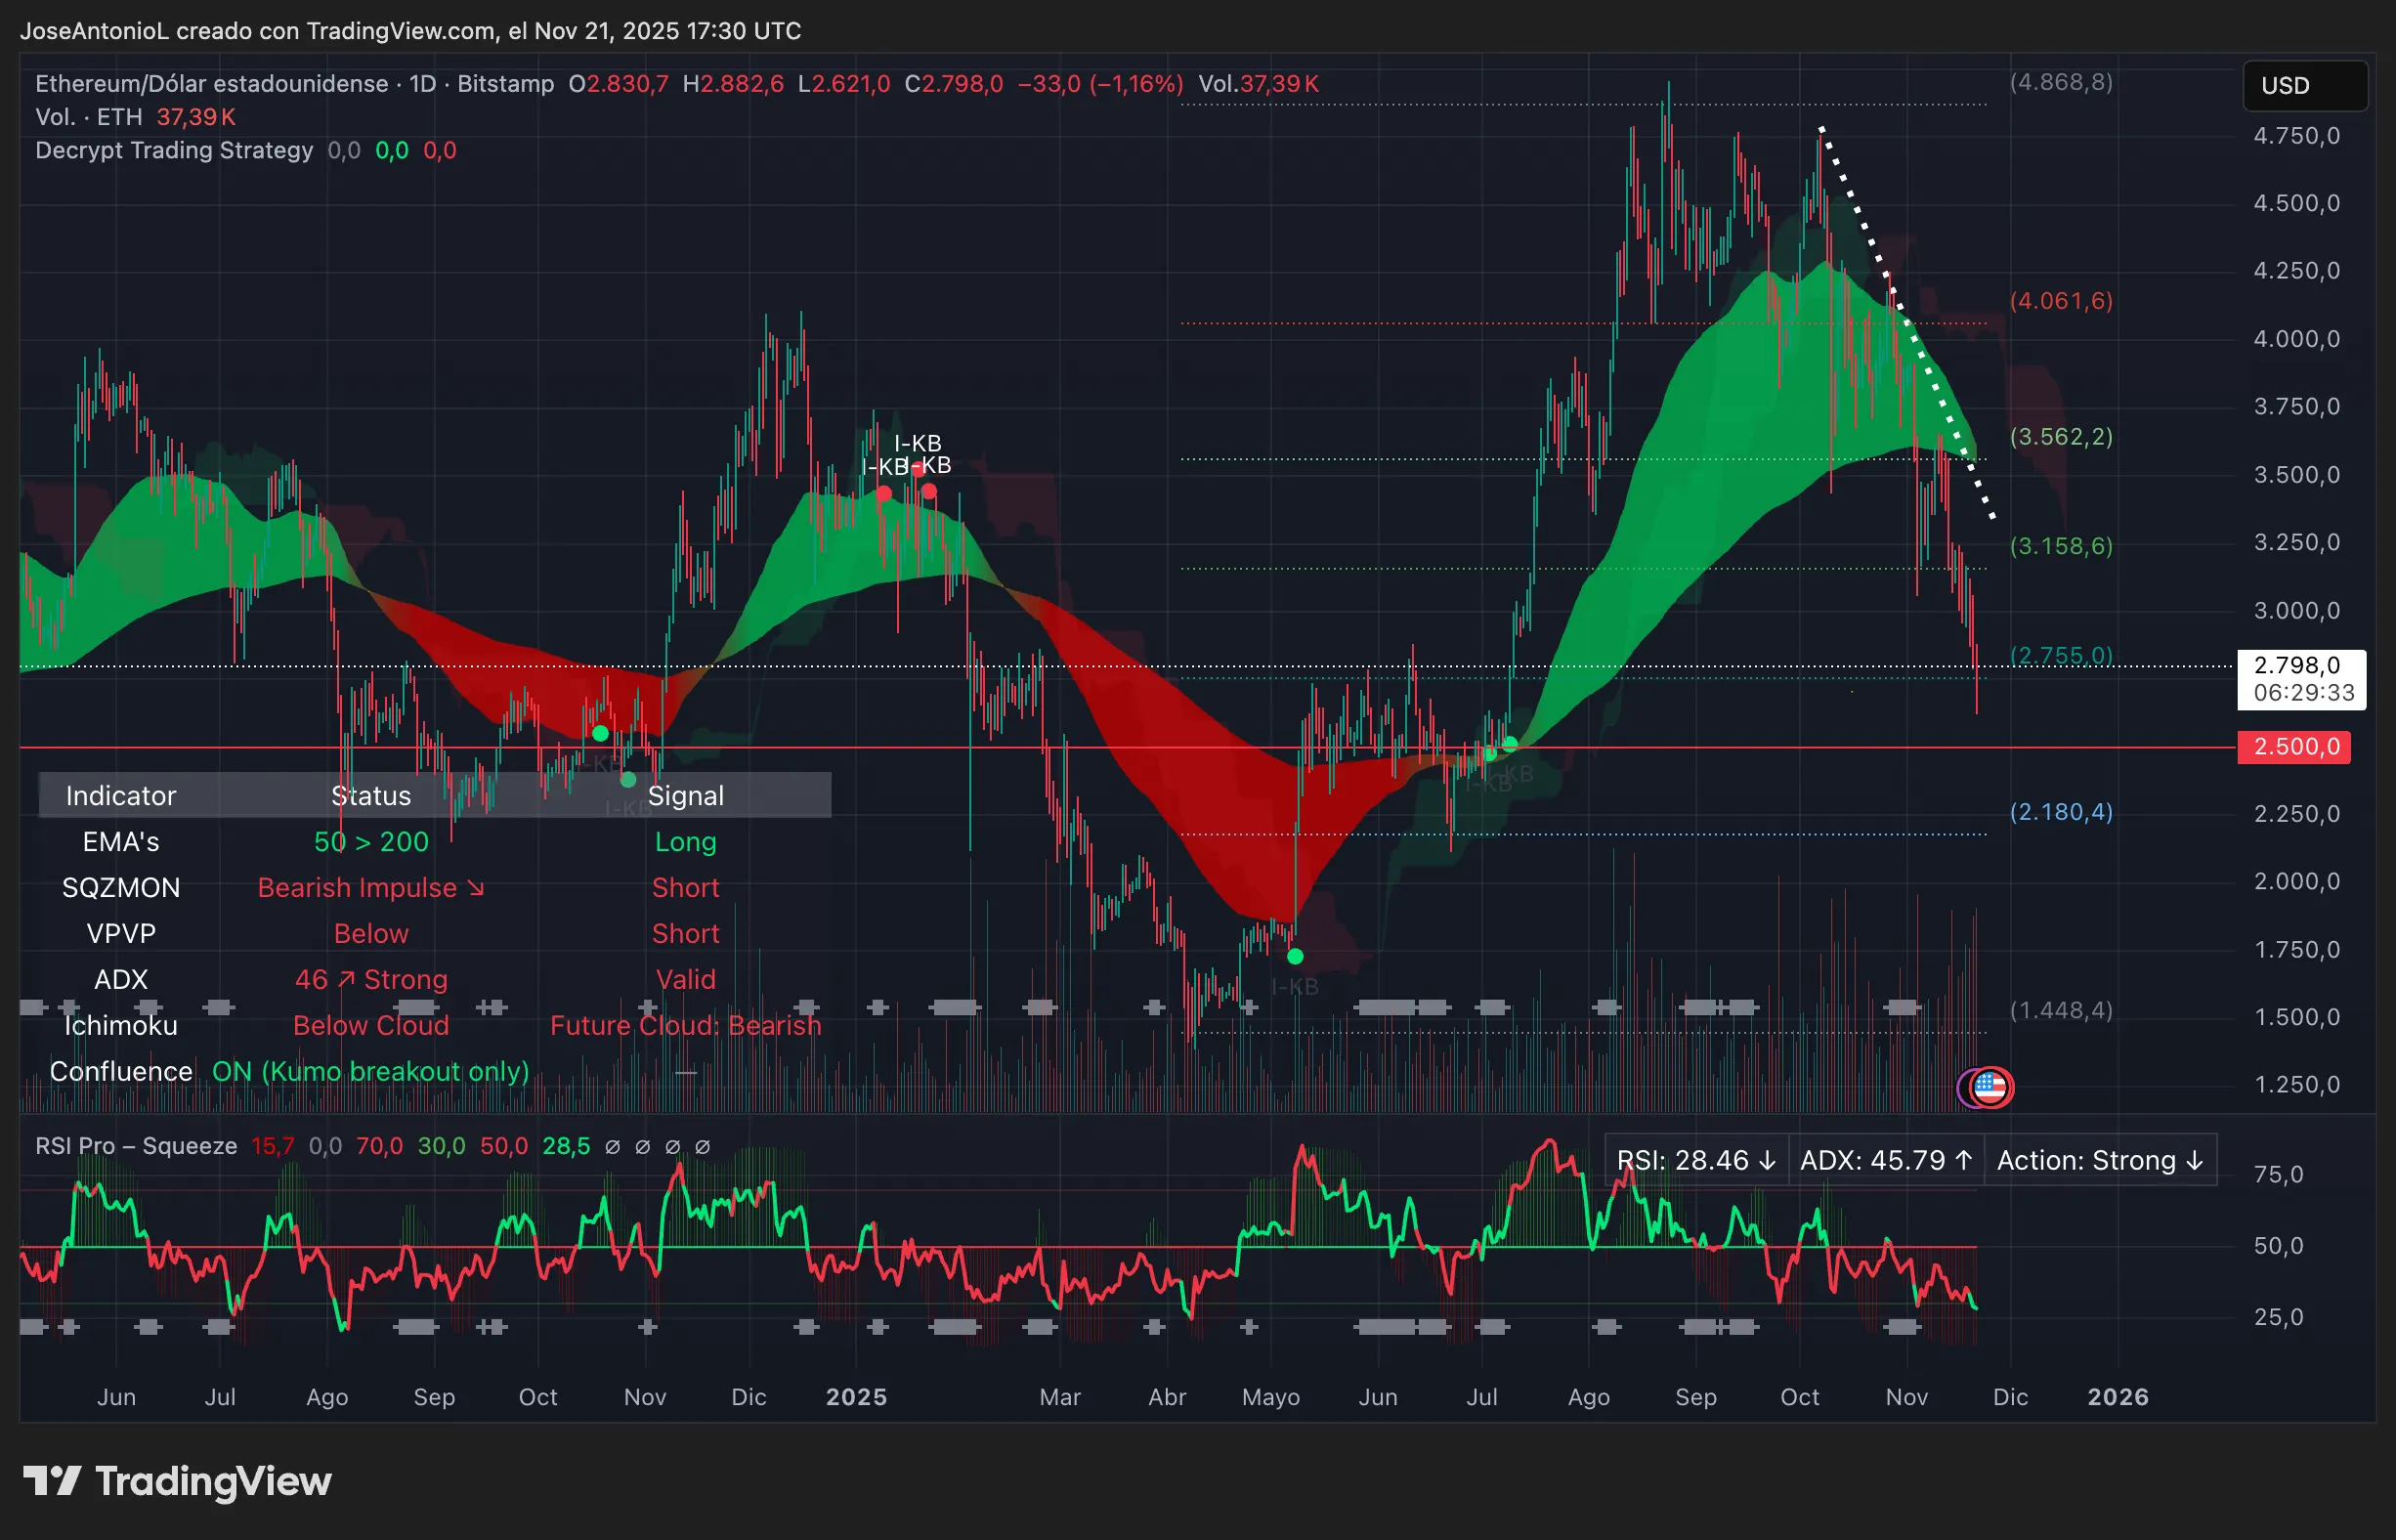
Unlike Bitcoin, Ethereum hasn’t fully confirmed its death cross yet—the 50-day EMA is still technically above the 200-day, giving it a “long” signal on an indicator that is obviously hours away from changing to bearish. The gap is razor-thin and closing fast. More importantly, ETH’s price is trading well below both EMAs, rendering that technical distinction somewhat meaningless. The bearish momentum is clearly established.
A good way to see the natural support zones is using the Fibonacci retracements: a set of natural clusters that appear during a trend, showing supports and resistances in a specific timeframe—not because of price, but because of natural proportions.
Right now, ETH is testing the 0.618 Fibonacci level at approximately $2,755. If this level breaks, the next Fibonacci support doesn’t appear until $2,180, which would represent a massive 22% drop from current prices, and would resolve a price market on Myriad betting on ETH’s moon or doom.
The ADX for Ethereum is even stronger than Bitcoin’s at 46, indicating the downtrend is rock-solid. Meanwhile, RSI sits at 28.46—not quite as oversold as Bitcoin but definitely in stressed territory. The Squeeze Momentum Indicator shows “bearish impulse” here too, confirming sellers are in control.
XRP price: Another death cross in place
XRP is showing relative strength compared to its larger peers, down just 0.50% to close at $1.98 after opening at $1.99 and hitting an intraday low of $1.81796. Don’t let that modest percentage fool you though—the technical damage is real.
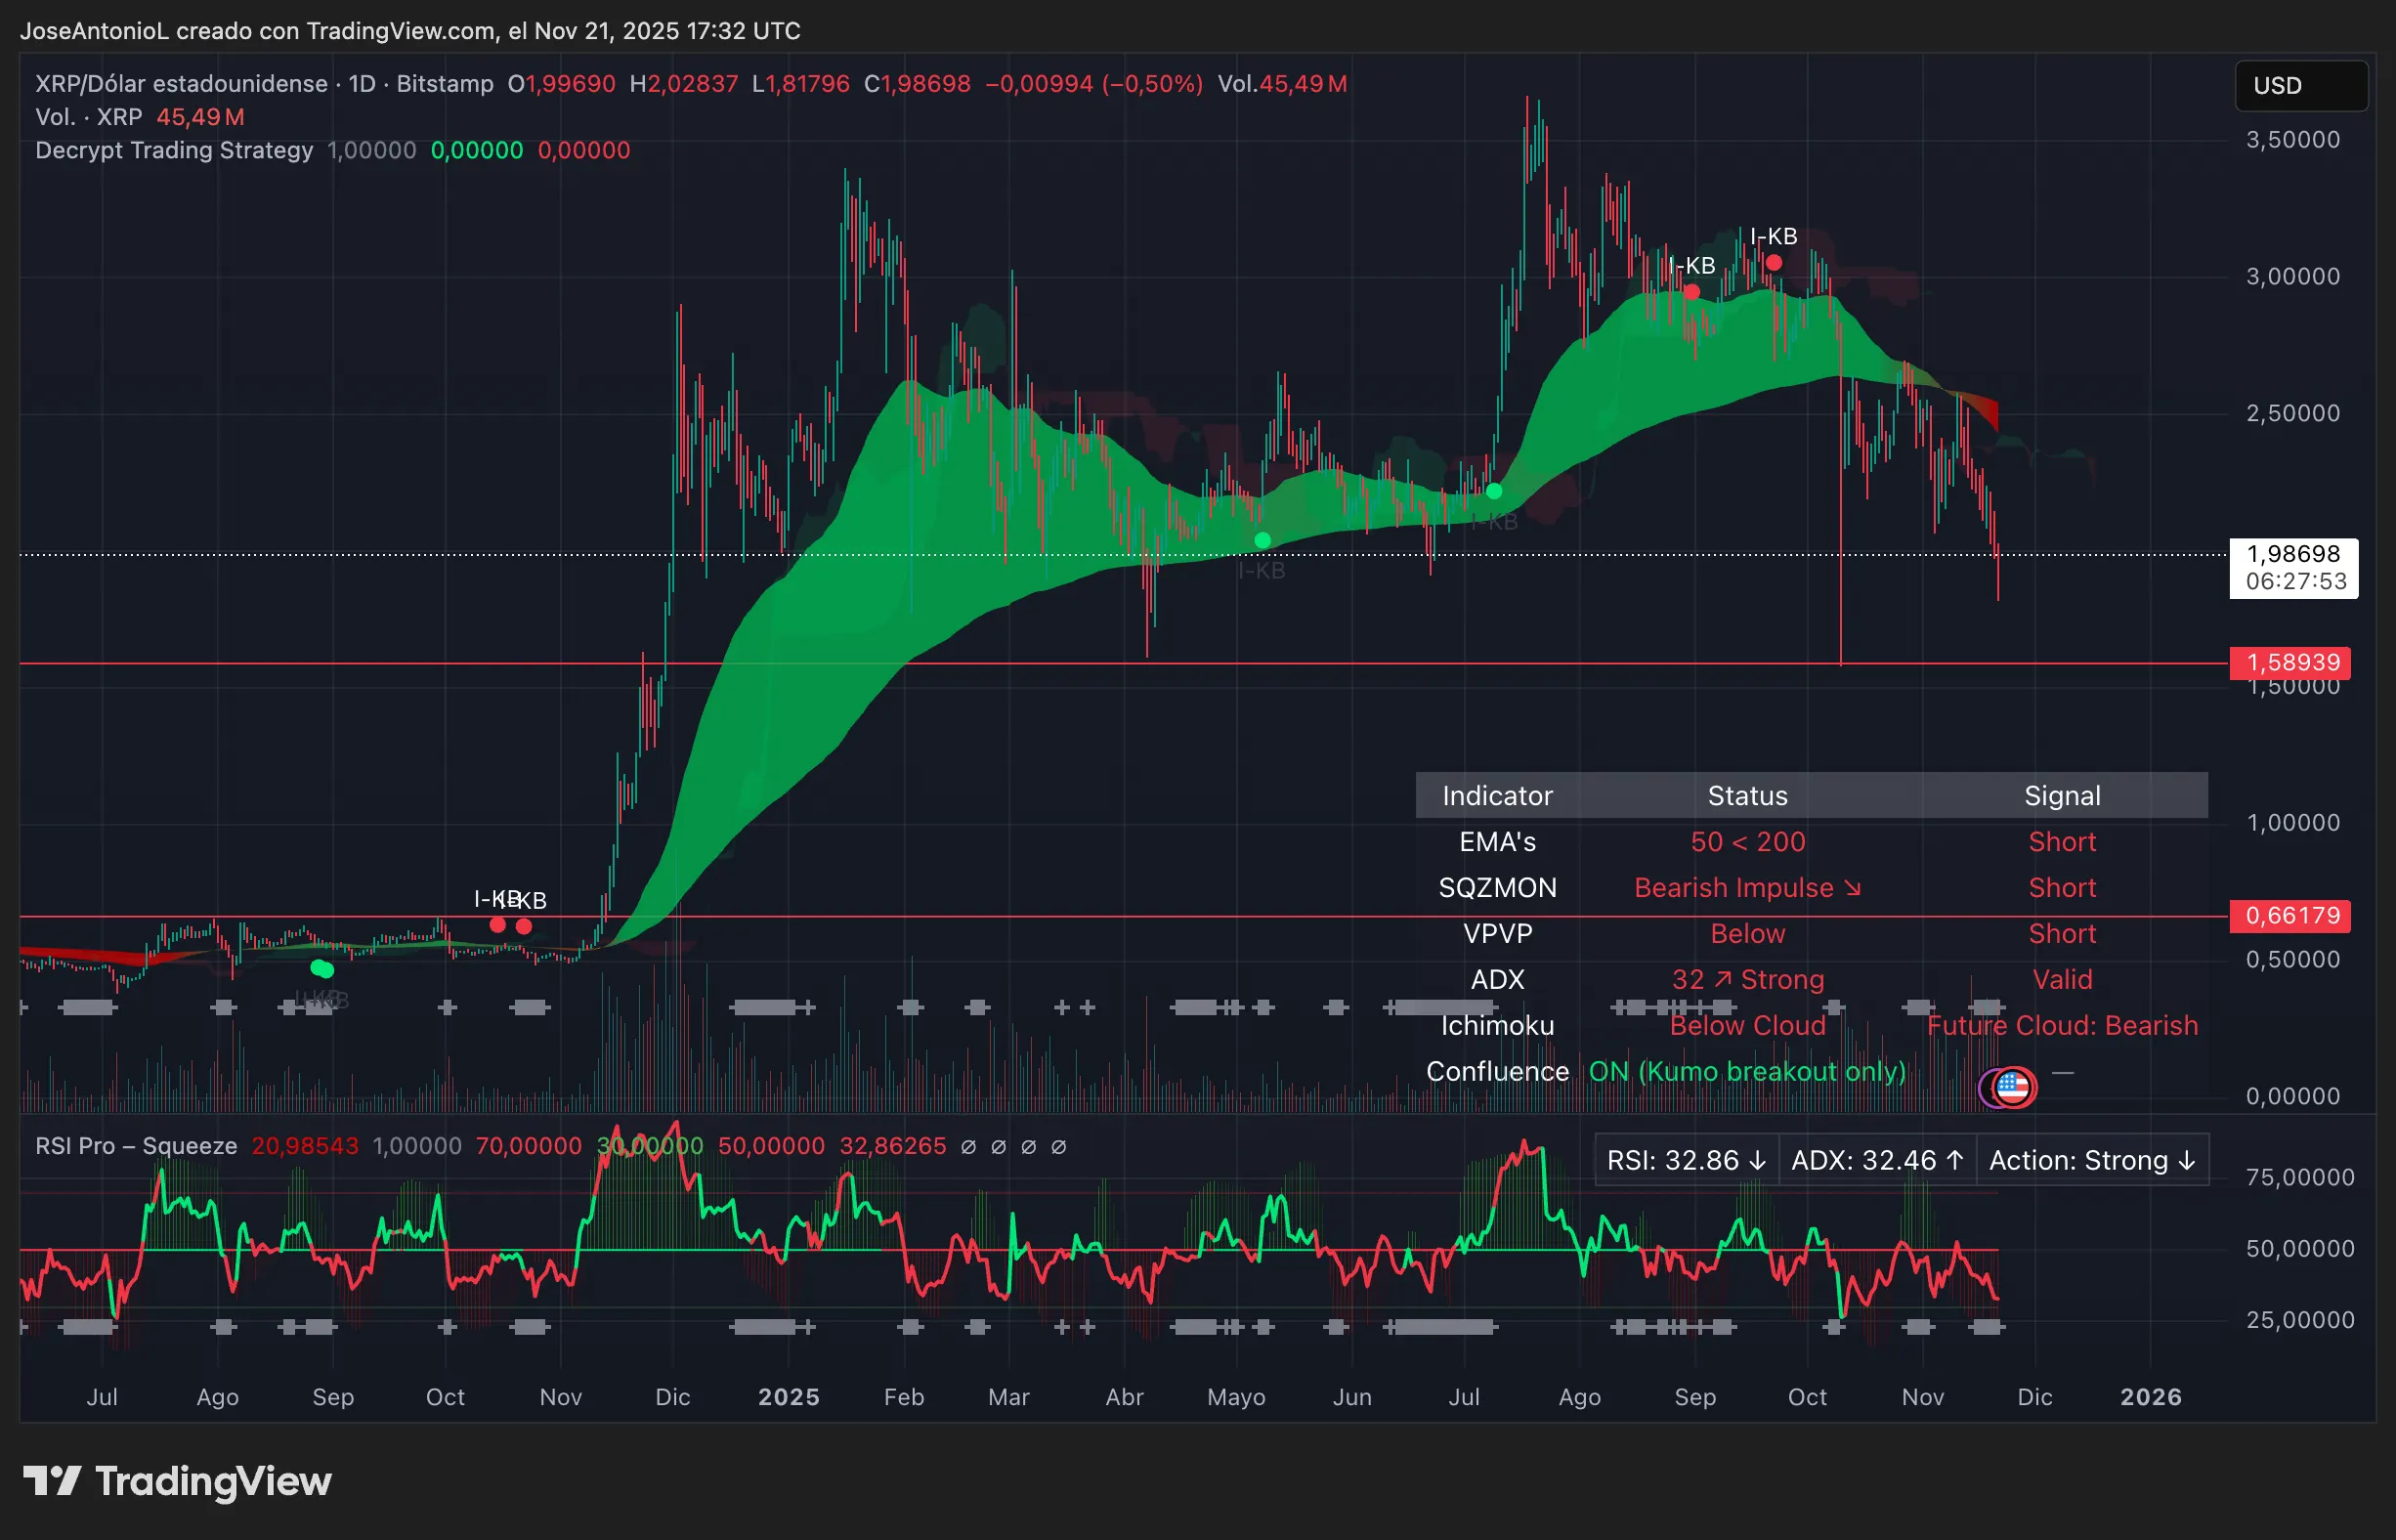
Like Bitcoin, the Ripple-linked XRP has confirmed a full death cross with its 50-day EMA now below the 200-day. The price of XRP is trading beneath both EMAs, and with an ADX of 32, the downtrend has enough strength to continue. While 32 isn’t as extreme as Bitcoin’s 41 or Ethereum’s 46, it’s still well above the 25 threshold that confirms a trend is in place rather than just random chop.
The RSI at 32.86 shows XRP is approaching oversold territory but hasn’t quite reached the extreme stress levels of Bitcoin and Ethereum. This could mean two things: either XRP has more downside before finding equilibrium, or it’s showing genuine relative strength that could make it a safer harbor if the broader market continues tanking.
XRP had such a crazy year that its price action shows only two major horizontal support levels that should concern XRP holders—and that would be very painful for hodlers, considering the movement from the all-time high to those targets.
The next major support zone sits at $1.589, which represents a potential 20% drop from current levels. If that breaks, there’s very little support until $0.66, a catastrophic 67% plunge from current prices and almost 80% from all-time high zone that would take XRP back to early 2024 levels.
The Squeeze Momentum Indicator is showing “bearish impulse,” and like the other coins, the volume profile indicates XRP’s price is trading below key volume levels, meaning there’s not much buying interest stepping in to defend current prices.
Disclaimer
The views and opinions expressed by the author are for informational purposes only and do not constitute financial, investment, or other advice.
Daily Debrief Newsletter
Start every day with the top news stories right now, plus original features, a podcast, videos and more.
Read the full article here
Fact Checker
Verify the accuracy of this article using AI-powered analysis and real-time sources.
Get Your Fact Check Report
Enter your email to receive detailed fact-checking analysis
Continue with Full Access
You've used your 5 free reports. Sign up for unlimited access!
Already have an account? Sign in here