


Listen to the article
Bitcoin’s (BTC) range-bound trading within the $60,000 to $73,000 range is impressive, especially when considering the macroeconomic backdrop of Brent crude oil rising to levels not seen since 2008, a hot war between the US, Israel and Iran, and a volatile stock market where the S&P 500 index trades at a 3.95% year-to-date loss.
Despite these intensifying headwinds, Bitcoin buyers have shown a steady appetite for buying the price drops to $60,000, and while the level currently holds as support, the risk of lower prices is not zero.
Bitcoin’s 1-day chart shows a bearish continuation pattern, with one pattern confirmed on Jan. 20 as BTC price entered a correction to $60,014, and a second bear flag currently in play. Every price rally to the flag’s overhead trendline has been rebuffed since Feb. 8, and technical analysis stresses the importance of a rally and multi-day candle close above $76,000 to negate the pattern.
Ideally, a rally to $76,000 would hold through a 2- to 3-day consecutive-candle close, followed by a retest of the trendline at $75,000 to confirm a support-resistance flip, where a former resistance level is now confirmed as support.
Analysis by chartered market technician Aksel Kibar predicts a potential price drop to $52,500. Referencing analysis from March 18, Kibar said that a,
“Breakdown of the lower boundary will be the signal for a possible move toward $52,500.”
Related: Bitcoin traders forecast short-term downside even as BTC price chases $68K
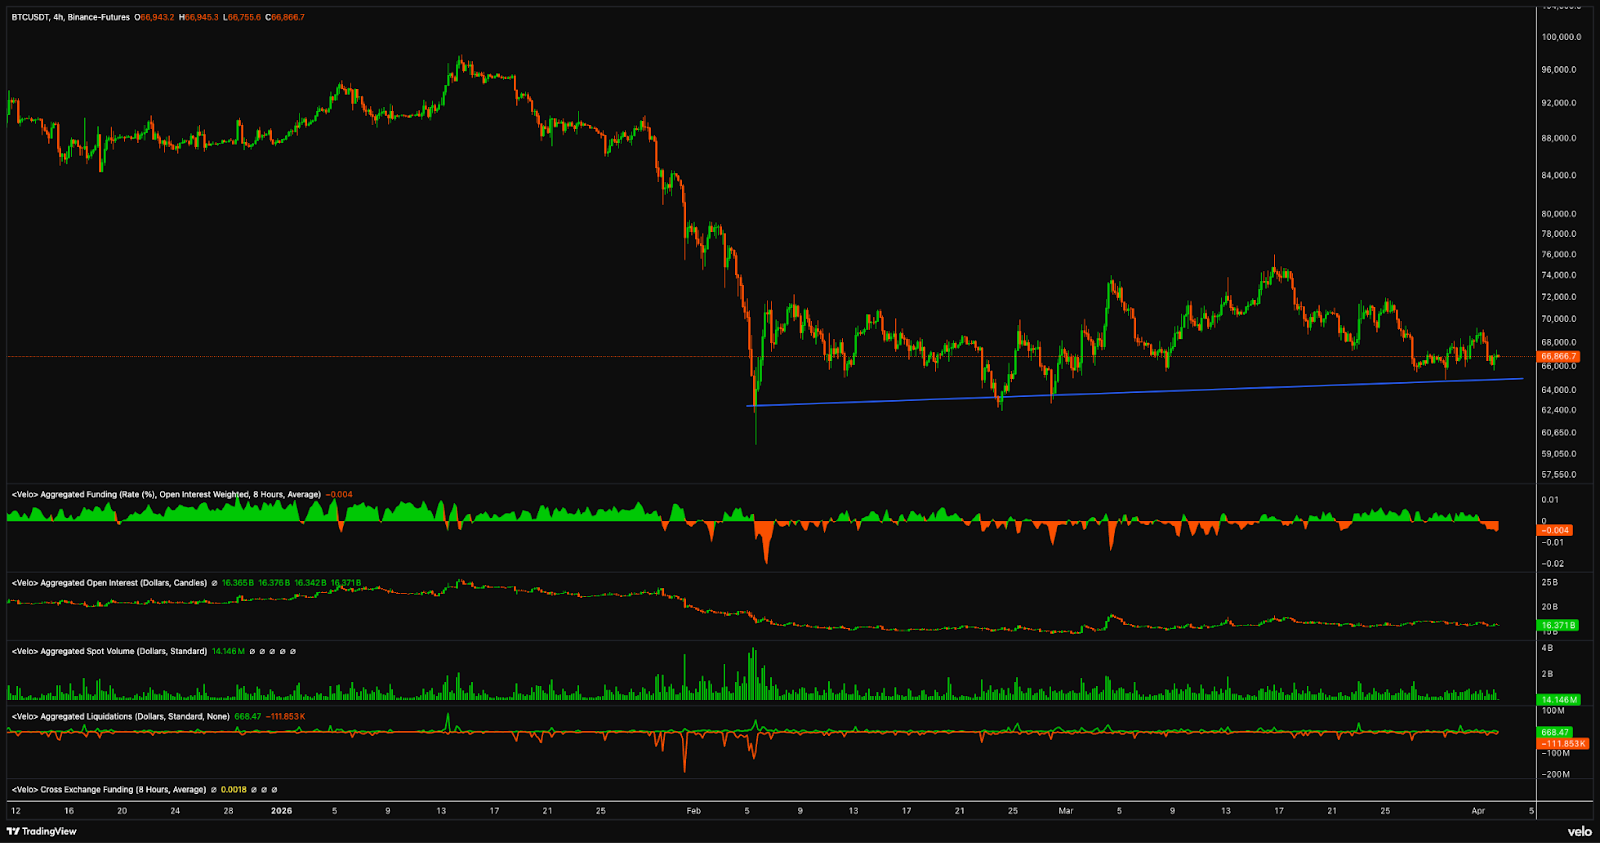
Data from Velo highlights the relatively flat market demand across Bitcoin’s spot and futures markets. Although traders appear to view instances where BTC’s funding rate turns negative as a buying opportunity, their confidence is largely absent during rallies into the bear flag’s trendline resistance.
Evidence of this is seen in Bitcoin’s aggregated open interest remaining pinned below $20 billion, a level not seen since Feb. 2 when BTC traded near $79,000.
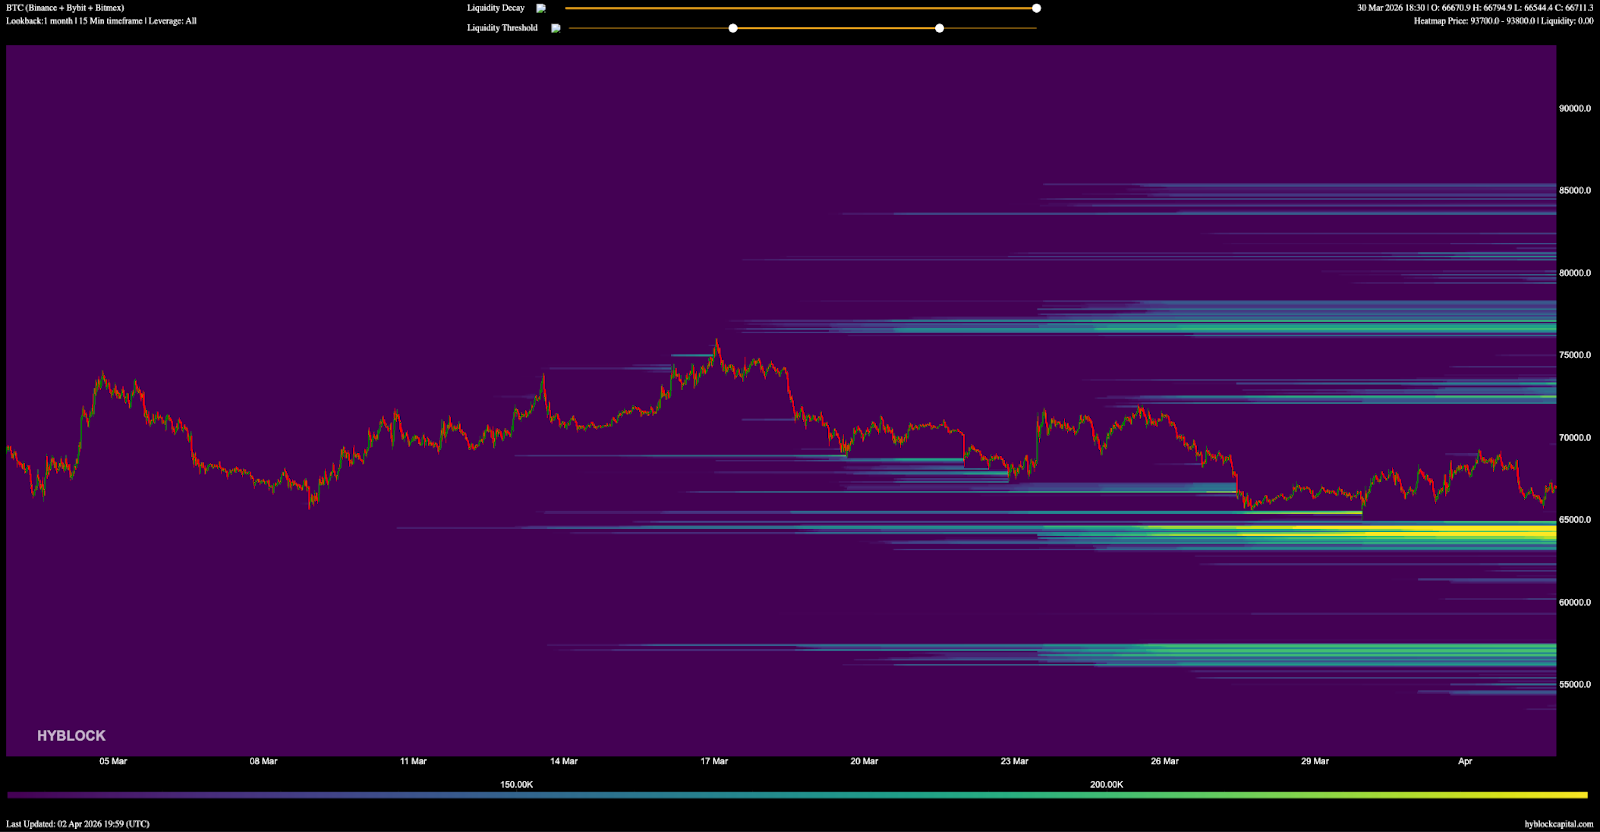
Regarding Kibar’s $52,500 price prediction and its alignment with Bitcoin’s futures markets, Hyblock liquidation heatmap data shows a large number of leveraged long positions at risk of liquidation if BTC falls into the $63,000 to $65,000 range.
Below this is a liquidity gap, and the next block of open margin long positions starts in the $57,500 to $56,000 range.
The current price action essentially reflects a market that trades sideways and consolidates as traders search for capital flow or narrative-related factors that would push them into larger directional bets.
Until such a catalyst emerges, it’s likely that Bitcoin will continue to trade within its $10,000 range, with $60,000 as the lowest key support and $70,000 as the most challenging level of resistance.
This article is produced in accordance with Cointelegraph’s Editorial Policy and is intended for informational purposes only. It does not constitute investment advice or recommendations. All investments and trades carry risk; readers are encouraged to conduct independent research before making any decisions. Cointelegraph makes no guarantees regarding the accuracy or completeness of the information presented, including forward-looking statements, and will not be liable for any loss or damage arising from reliance on this content.
Read the full article here
Fact Checker
Verify the accuracy of this article using AI-powered analysis and real-time sources.