


Listen to the article
Altcoins, excluding Ether (ETH), have recorded $209 billion in net selling volume since January 2025, marking one of the steepest declines in speculative demand for crypto assets this cycle.
On Binance, altcoin trading volumes dropped roughly 50% since November 2025, reflecting a steady dip in activity. The decrease also coincides with an increase in Bitcoin’s volume share on the exchange.
Analysts said that the contraction in altcoin demand, alongside elevated stablecoin dominance, signals that the broader market is shifting its capital toward BTC during the current downtrend.
Altcoin spot volume imbalance deepens against Bitcoin
Crypto analyst IT Tech noted that the cumulative buy and sell difference for altcoins, excluding BTC and Ether (ETH), reached -$209 billion. The metric measures net spot demand across centralized exchanges for altcoin trading pairs. A positive reading indicates rising spot demand, which was briefly observed back in January 2025.
A negative cumulative delta at this scale signals the absence of consistent spot buyers. The analyst noted that the metric tracks net flow imbalance rather than price valuation, so it does not indicate a market bottom. Over the past 13 months, capital has exited the altcoin markets without significant counterflows.
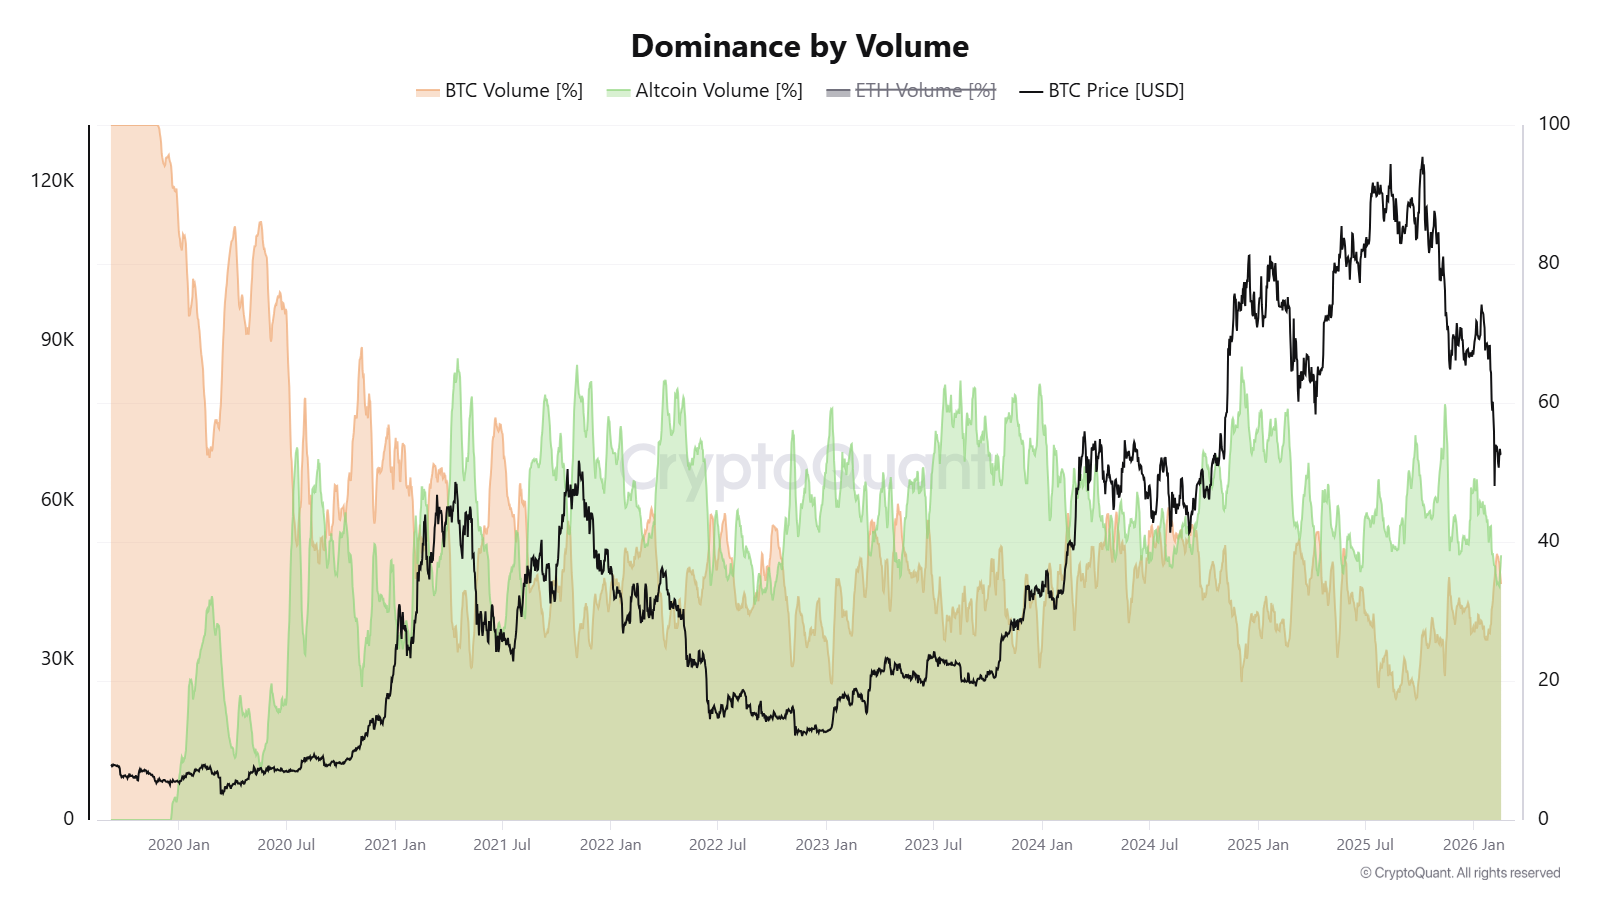
Volume data from Binance reinforces the shift. As BTC tested the $60,000 level in early February, the total trading volume was redistributed. On Feb. 7, Bitcoin volumes rose to 36.8% of total activity. Altcoin volumes dropped to 33.6% by mid-February, from a high of 59.2% in November.
According to crypto analyst Darkfost, similar rotations appeared in April 2025, August 2024, and October 2022. During these corrective phases, capital consolidated into Bitcoin while altcoin volumes contracted.
Related: New Bitcoin whales are trapped underwater, but for how long?
Tether dominance rises to its all-time high level
Tether’s USDt (USDT) market cap dominance reached the 8% level on the one-week chart, aligning with prior highs which lasted between June 2022 and October 2023. The rising stablecoin dominance typically coincides with capital moving into dollar-pegged assets rather than deploying into tokens like BTC (BTC) and Ether (ETH).
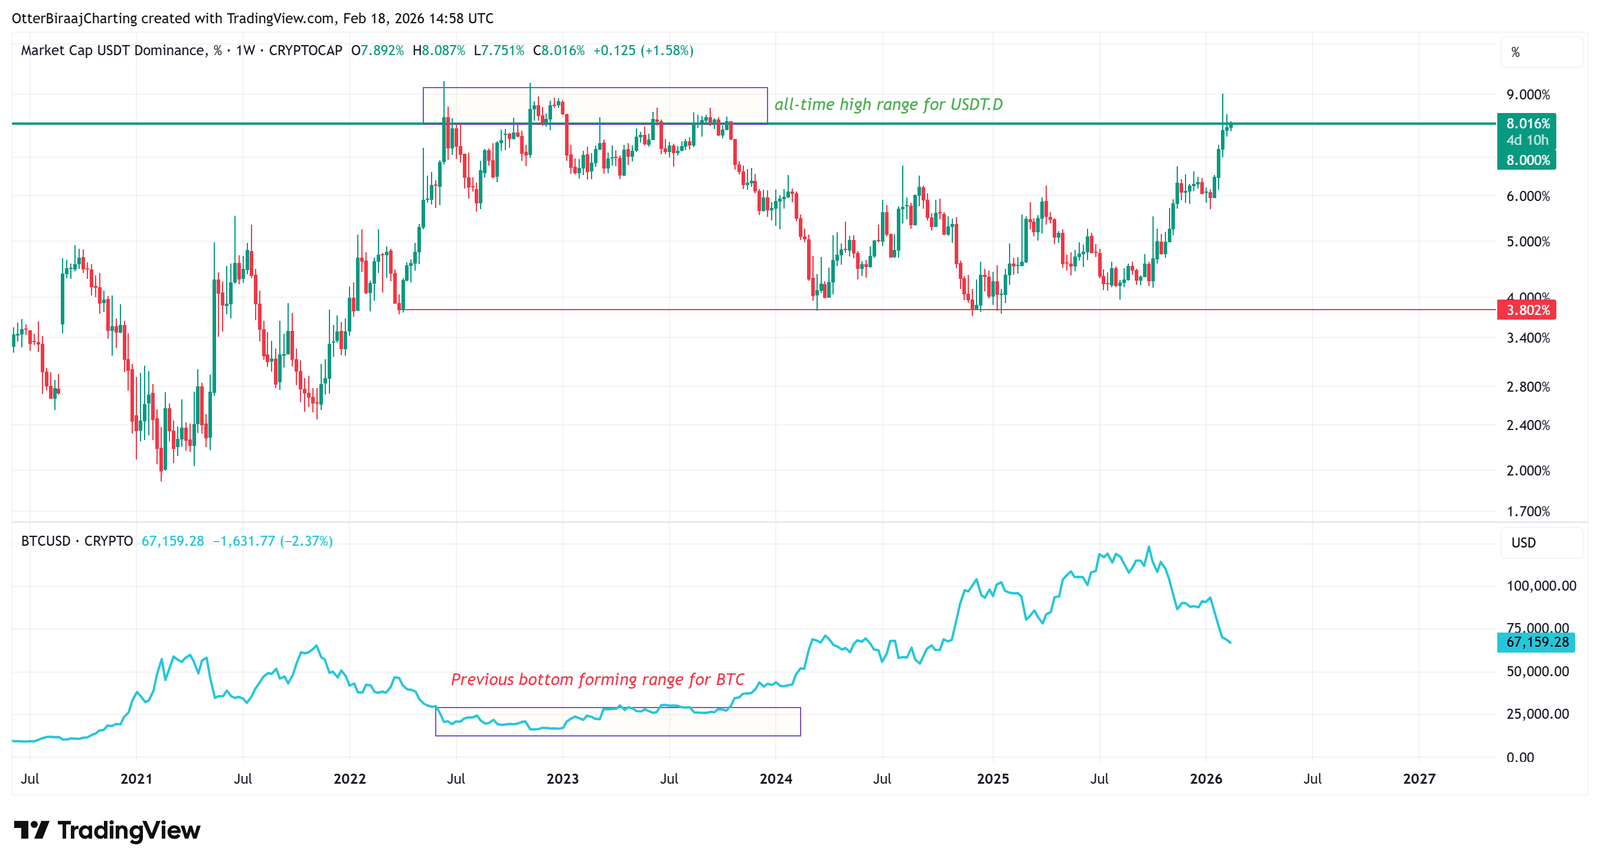
As observed, the elevated USDT dominance coincided with Bitcoin consolidating near bear market lows, as observed in 2022 and 2023. A decline in dominance has often marked one of the earliest signals of a renewed bullish trend.
Previously, the USDT dominance chart formed lows around 3.80-4% in March 2024, December 2024, and October 2025. These periods coincided with Bitcoin setting new all-time highs near $72,000, $104,000, and $126,000, respectively.
Related: Wells Fargo sees ‘YOLO’ trade driving $150B into Bitcoin and risk assets
This article does not contain investment advice or recommendations. Every investment and trading move involves risk, and readers should conduct their own research when making a decision. While we strive to provide accurate and timely information, Cointelegraph does not guarantee the accuracy, completeness, or reliability of any information in this article. This article may contain forward-looking statements that are subject to risks and uncertainties. Cointelegraph will not be liable for any loss or damage arising from your reliance on this information.
Read the full article here
Fact Checker
Verify the accuracy of this article using AI-powered analysis and real-time sources.