

 Freedom Index

Listen to the article
In brief
- U.S. consumer prices rose 3.7% year over year in September, above the 3.6% forecast, as gasoline jumped 9.1% in a single month.
- Odds of an October Fed rate hike roughly doubled from 22% after the report, and the 10-year Treasury yield climbed to about 5.3%.
- Bitcoin fell 1.5% to $82,142 and is holding the $81,847 to $82,305 Fibonacci golden zone, with $81,603 as the next support.
Bitcoin fell 1.5% to $82,142 on Wednesday after U.S. inflation came in hotter than expected, dragging most of the crypto market down with it. Ethereum dropped 2.8% to $2,440, Solana lost 1.9% and XRP slid 1.3%, while total crypto market cap shed 0.7% to $2.8 trillion.
The Consumer Price Index rose 0.6% in September and 3.7% over the past year, up from 3.4% in August, per the Bureau of Labor Statistics. Economists expected 3.6%. Gasoline prices jumped 9.1% in a single month and accounted for more than half of the increase.
Core CPI, which strips out volatile food and energy prices, rose 2.6% annually against a 2.5% forecast. That is the reading the Federal Reserve watches most closely, since it shows whether price pressure is spreading into rent, airfares, and services.
Expensive gasoline starts with expensive oil, which has traded above $90 a barrel for most of the past two months amid the war between the U.S. and Iran. Pricier fuel raises the cost of shipping and producing almost everything.
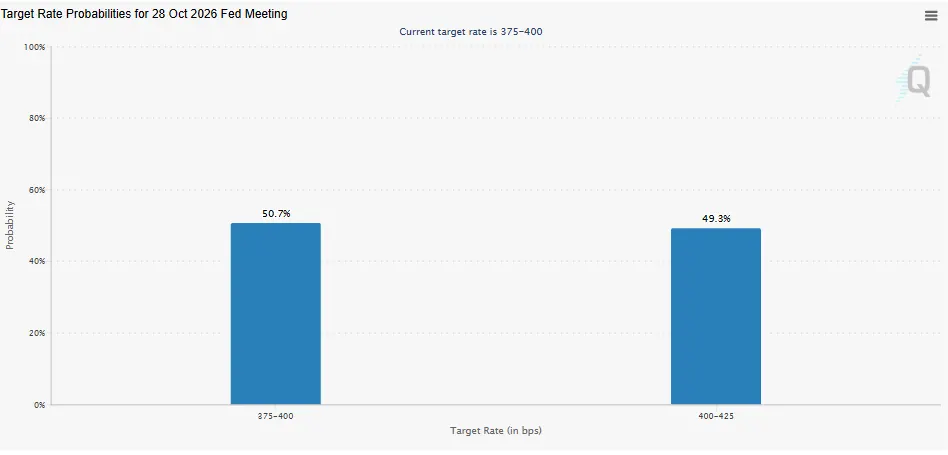
When inflation runs hot, the Fed raises interest rates to cool spending. It already hiked in September to a 3.75%-4.00% range, and traders now see roughly 44% to 49% odds of another hike at its October 27-28 meeting, up from 22% before the report, according to CME FedWatch.
The 2-year Treasury yield, which closely tracks Fed rate expectations, jumped about 10 basis points to roughly 4.9%, while the 10-year climbed to about 5.3%, near 24-year highs.
Higher yields hit crypto directly. A government bond paying 5.3% with almost no risk competes with Bitcoin, which pays nothing. Rising rates also make borrowing more expensive and tend to strengthen the dollar, draining the cheap money speculative assets feed on, which is why the S&P 500 fell 0.6% and the Nasdaq 0.8% on the same news.
Crypto also swings harder than stocks because many traders borrow to bet on rising prices, and when the price drops past a set level, exchanges automatically close those positions, a process called liquidation, and that forced selling can push prices lower and trigger more liquidations in a chain.

BitcoinBTC · USD
$81,880−1.88%
Oct 7Oct 9Oct 11Oct 12Oct 14
$84.2k$83.1k$81.9k$80.7k
24h HighHigh$84,025
24h LowLow$81,655
VolVol$1.4B
Market projectionsOdds by Myriad
 →
→At the moment, more than $281 million in crypto derivatives positions have been liquidated in the past 24 hours, with most of it coming in just the last four hours—and the majority of that coming from Bitcoin long positions (the bulls betting the price would go up, and now paying the price when it dropped).
Bitcoin price: The macro picture is punching hard
On the daily chart, Bitcoin opened at $83,066 and now trades near $82,211, sitting inside the Fibonacci “golden zone” it reclaimed on Tuesday. That zone marks an area where pullbacks within uptrends often attract buyers.
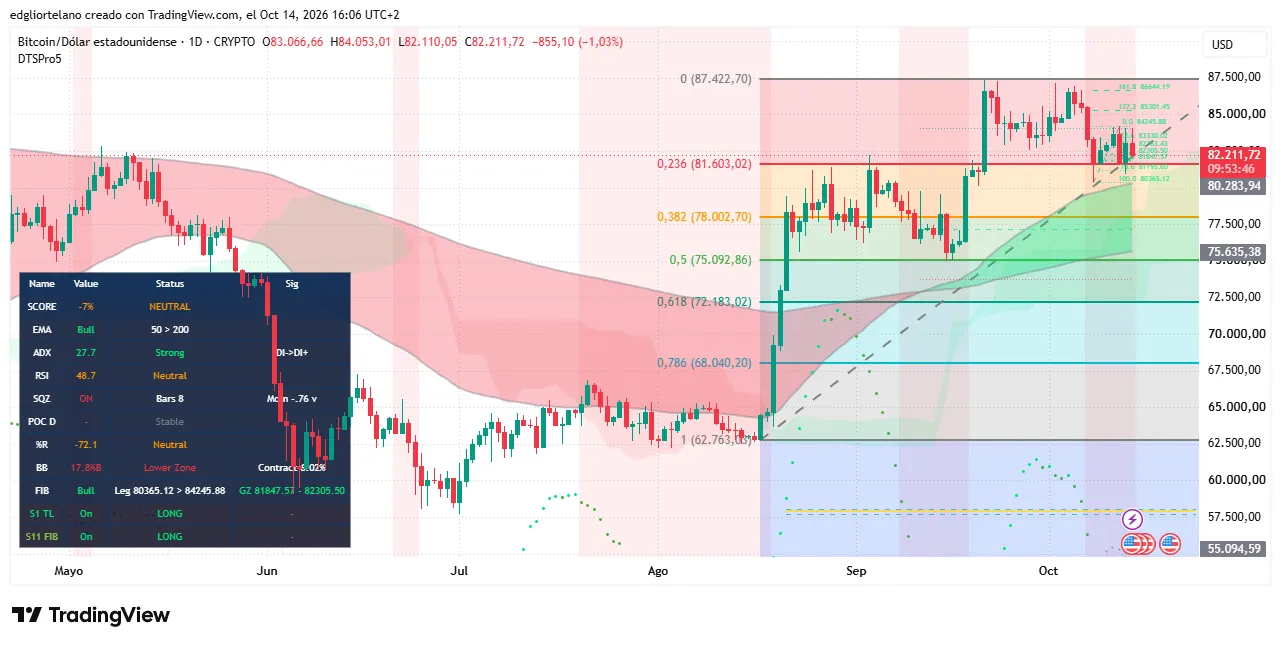
The average price of the last 50 days remains above the 200-day average, a setup traders read as an intact long-term uptrend. The Average Directional Index, which gauges trend strength on a 0-to-100 scale where readings above 25 confirm a trend, sits at 27.7 with buyers still ahead, down from 29.9 on Tuesday, meaning traders are bullish, just not as much as they used to be.
The Relative Strength Index, a momentum gauge from 0 to 100, slipped to 48.7, just under the 50 line that separates bullish from bearish momentum. The Squeeze Momentum Indicator has been on for eight sessions, meaning volatility is compressed and a big move is building, and its -0.76 reading leans bearish by a small margin.
A daily close below $81,603 would break the golden zone and bring the $80,365 swing low into play, with the trend band near $80,284 right under it; losing that would expose $78,003. On the upside, bulls need to reclaim $84,245 before targeting $85,301, $86,644 and the October high of $87,422.
The next test arrives Thursday with the Producer Price Index, which tracks what businesses pay for goods and services, and the Fed announces its rate decision on October 28.
Disclaimer
The views and opinions expressed by the author are for informational purposes only and do not constitute financial, investment, or other advice.
Daily Debrief Newsletter
Start every day with the top news stories right now, plus original features, a podcast, videos and more.
Read the full article here
Fact Checker
Verify the accuracy of this article using AI-powered analysis and real-time sources.