


Listen to the article
Bitcoin (BTC) has fallen 3% over the past 24 hours, trading into a dense buy-side liquidity zone after slipping below $61,000. More than $525 million in buy bids initially stacked between $60,500 and $61,500 created a key area of demand as liquidation risk builds on both sides of the market.
BTC’s orderbook data shows concentrated liquidity pockets below $60,500 and near $65,000, placing liquidity flows at the center of Bitcoin’s short-term price action.
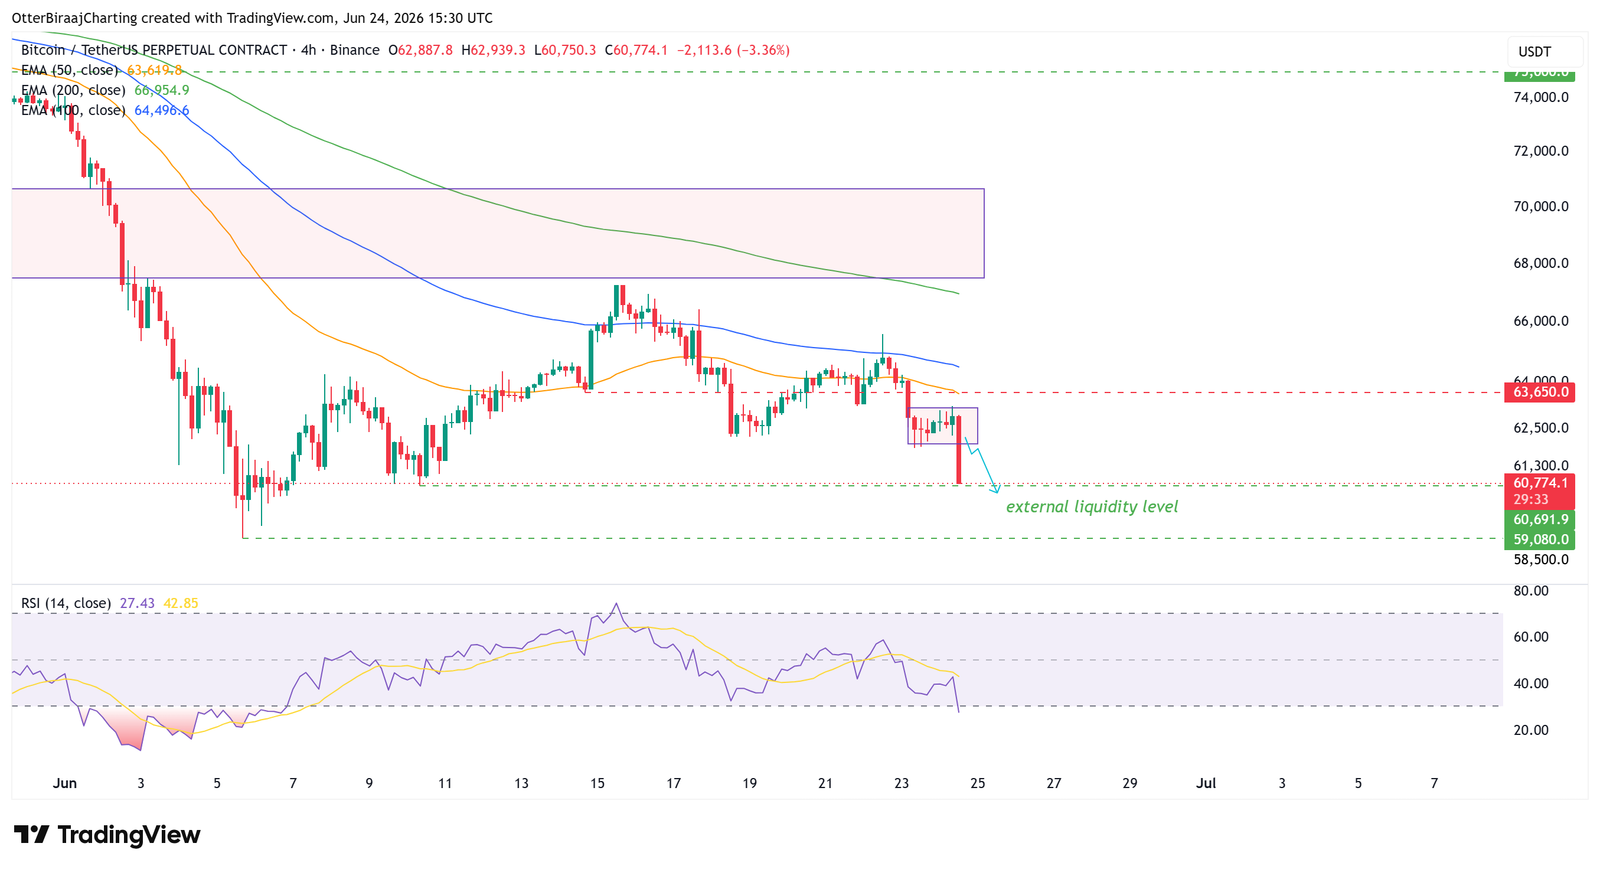
Bitcoin momentum weakens below $63,000
Bitcoin closed at $62,700 on Tuesday, its lowest daily candle close since June 10. The move also produced a bearish engulfing candle against Monday’s range, erasing the prior day’s gains and signaling weaker short-term momentum.
BTC/USDT, one-day chart. Source: Cointelegraph/TradingView
The price has since consolidated beneath $63,000 after losing that level as support. The one-hour chart shows a series of lower highs following the rejection near $66,000 earlier this week. The momentum indicator, or relative strength index (RSI), has cooled from recent overbought levels, while Bitcoin continues to trade above the June range low near $60,500.
BTC/USD, one-hour chart. Source: Cointelegraph/TradingView
Crypto trader Lennaert Snyder called for caution and expected BTC to test the lower liquidity before considering long exposure. The trader said,
“Bitcoin started a little bounce, but I’m not convinced and not buying in yet,” Snyder wrote in a recent market update.
The trader identified $61,500 and $60,500 as the primary levels to watch for bullish reactions. On the upside, he pointed to $63,500 and $64,000 as potential areas where liquidity could attract price before another move lower.
Related: Multi-year Bitcoin holder selling falls to 19-month low as halving model flags new market bottom date
$530 million in BTC buy bids sit below $61,000
Data from Velo shows that BTC traders initially added 8,366 BTC to bid liquidity between $61,500 and $60,500. At the time of writing, Bitcoin has traded through a significant portion of that range, triggering roughly $270 million worth of buy orders as the price dipped below $61,000.
The remaining bids remain near the lower end of the liquidity cluster, where traders are attempting to absorb the latest wave of selling pressure.
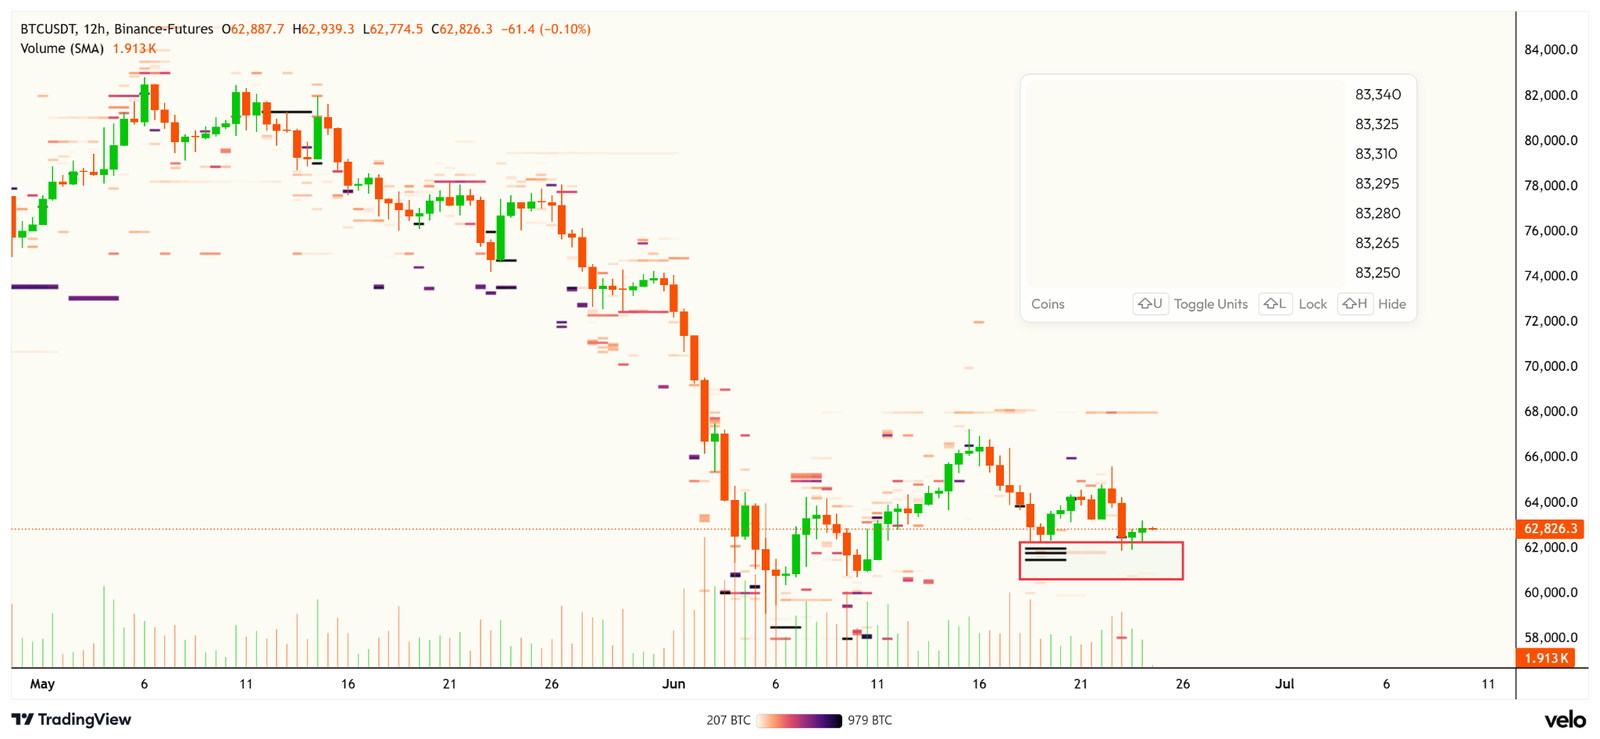
BTC buy bids analysis. Source: Velo Chart
The move below $61,000 has already flushed a significant portion of the leveraged long positions clustered around $61,500. CoinGlass data shows more than $125 million in long liquidations over the past hour, reducing downside liquidation pressure near the current price.
With much of the nearby long-side leverage cleared out, the liquidation map now shows a growing imbalance toward short positions positioned above spot price.
Now, more than $1.2 billion in short positions sit near $63,500. A stabilization in the remaining bid liquidity around $60,500-$61,000 may shift attention toward those positions, especially as the downside liquidation pools become less concentrated following the latest flush.
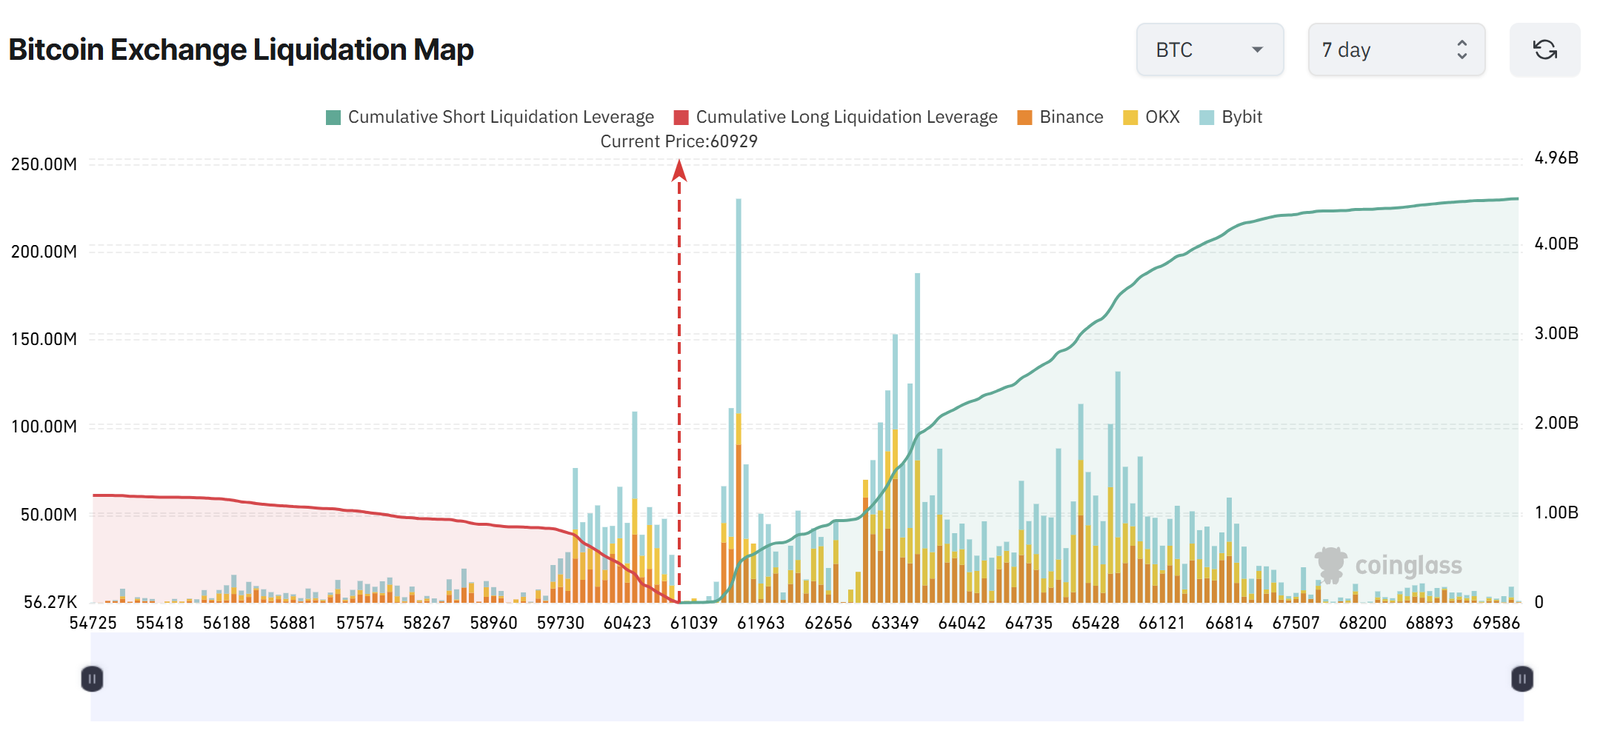
Bitcoin liquidation map. Source: CoinGlass
The next major concentration of liquidation risk sits near $65,000, where more than $2.4 billion in short positions are vulnerable. Such setups often trigger fast moves as liquidations fuel additional buying. For now, the largest liquidity concentrations remain near $60,500, where both spot demand and leveraged exposure remain heavily stacked.
Related: BTC price four-year trend calls for $76K as analysis says Bitcoin ‘not broken’
Read the full article here
Fact Checker
Verify the accuracy of this article using AI-powered analysis and real-time sources.