


Listen to the article
Market analysts say Bitcoin (BTC) is showing “renewed bullish momentum” after its 5% rally above $76,000 on Tuesday, with bulls eyeing further gains to $90,000 amid improving network activity.
Bitcoin price hits a 70-day high
Data from TradingView shows the BTC/USD pair rose over 5% on Tuesday to an intraday high of $76,120, levels last seen on Feb. 6.
The surge saw Bitcoin’s price reclaim key support levels, including the $75,000 zone where the 100-day exponential and simple moving averages converge.
“#Bitcoin surged above the $76,000 level, breaking above its March highs and signaling renewed bullish momentum,” analyst CryptoBlockto said in an X post on Tuesday.
The analyst pointed out that the next crucial resistance zone is $76,000 and that clearing it would confirm “a trend reversal and sustained upside momentum.”
From a technical perspective, Bitcoin is validating an ascending triangle after breaking above its upper trend line at $73,000 on Monday.
A daily candlestick close above the moving averages at $75,000 would confirm the breakout, with the next line of resistance being the psychological level at $80,000.
Above that, bulls could push the BTC price toward the triangle’s measured target of $89,050, 18% above the current price.
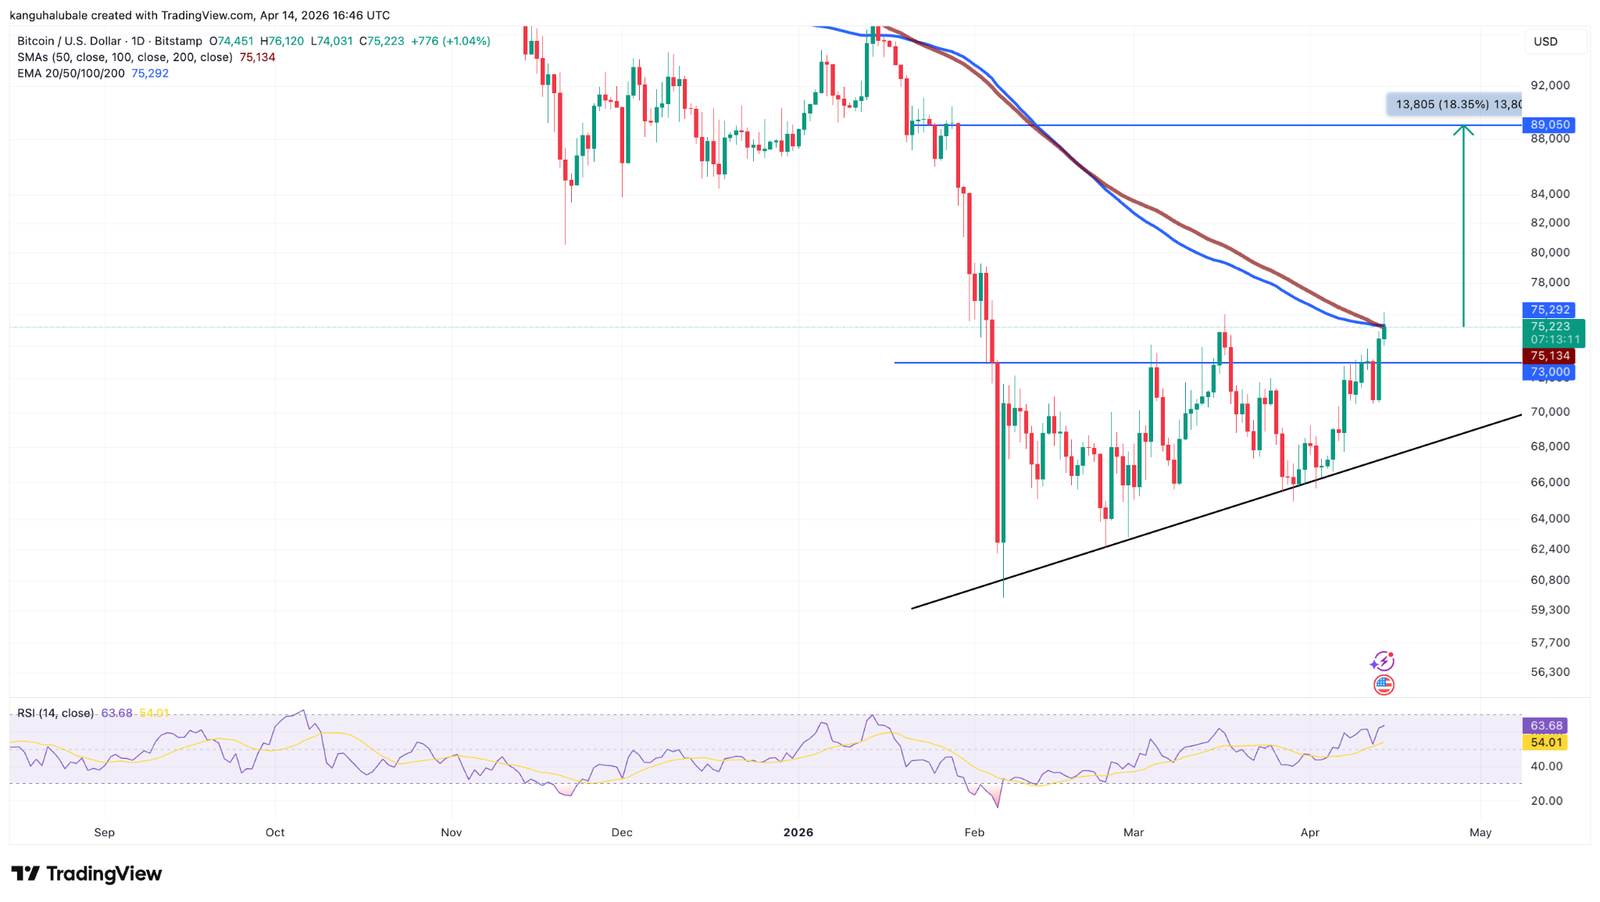
The daily relative strength index has increased to 63 from oversold conditions at 15 reached on Feb. 6, suggesting increasing bullish momentum.
“#Bitcoin is #trading within the horizontal supply zone of an ascending triangle pattern. The 100MA is also acting as a resistance barrier above the current price action,” analyst CryptOpus said in a recent X post, adding:
“A strong breakout above both the #pattern and the 100MA would confirm a #bullish rally in the market.”
As Cointelegraph reported, a close above $76,000 would complete a bullish ascending triangle pattern, clearing the path for a potential rally to $84,000.
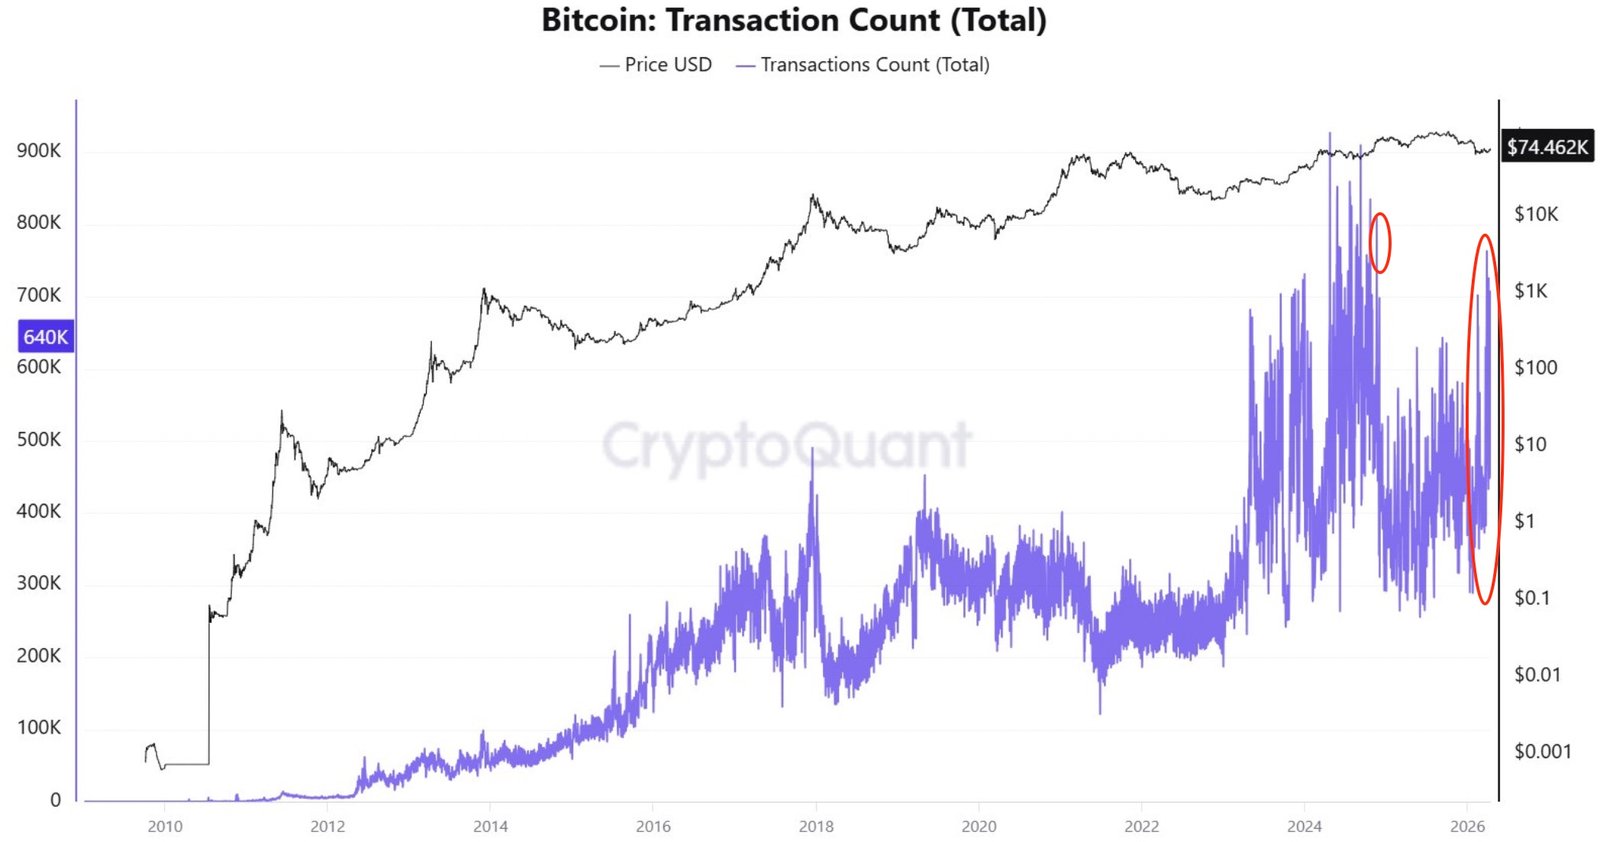
Bitcoin’s transaction activity hits 17-month highs
The strength in BTC price is reflected in onchain activity, with Bitcoin’s daily transaction count rising by 62% in 2026 to 765,130 million on April 5.
This metric was last at these levels in November 2024, when the hype around the 2024 US Presidential Election pushed Bitcoin price above $100,000 for the first time in history.
“$BTC daily transaction count is higher than when $BTC was $120K,” analyst CW8900 said in an X post on Tuesday, adding:
“The network is showing bull market behavior.”
Bitcoin’s total fee volume has also climbed, increasing by 4% over the last week to $153,700, indicating “heightened onchain demand,” Glassnode said in its latest Market Pulse report, adding:
“This increase implies an uptick in network activity, potentially signalling a shift in user willingness to pay for transaction priority.”
Bitcoin’s increasing transaction count and fees mean that more users are interacting with the network. It suggests high network activity, which is often correlated with increased interest and market confidence.
This article is produced in accordance with Cointelegraph’s Editorial Policy and is intended for informational purposes only. It does not constitute investment advice or recommendations. All investments and trades carry risk; readers are encouraged to conduct independent research before making any decisions. Cointelegraph makes no guarantees regarding the accuracy or completeness of the information presented, including forward-looking statements, and will not be liable for any loss or damage arising from reliance on this content.
Read the full article here
Fact Checker
Verify the accuracy of this article using AI-powered analysis and real-time sources.