


Listen to the article
XRP (XRP) has been in an eight-month downtrend, with momentum and onchain indicators at levels that previously coincided with macro bottoms.
Data from TradingView reveals that the relative strength index (RSI) of the XRP/BTC ratio is at 24, the most oversold level since October 2025.
Such low levels in the daily RSI have marked market bottoms for the ratio, ultimately leading to 65% to 345% XRP price breakouts against Bitcoin as seen late 2024 and 2025.
The chart above also shows that the XRP/BTC pair is trading within a long consolidation range, which has previously acted as a strong launching pad for the ratio.
The last time XRP bottomed against Bitcoin around this zone was in June 2025. It marked the beginning of a 61% increase in the XRP/BTC ratio, accompanying a 92% XRP price rally to a multi-year high of $3.66.
Other instances shown by the yellow bars in the chart reinforce the reliability of this level in marking macro bottoms for XRP/BTC.
MVRV Z-Score suggests XRP price is bottoming
XRP’s MVRV Z-score is hovering near zero, a level that historically aligns with accumulation zones and market bottoms.
This indicates that most holders are close to breakeven, reducing sell pressure and signalling potential downside exhaustion. Similar patterns appeared in 2021, 2022 and 2024 before major rallies.
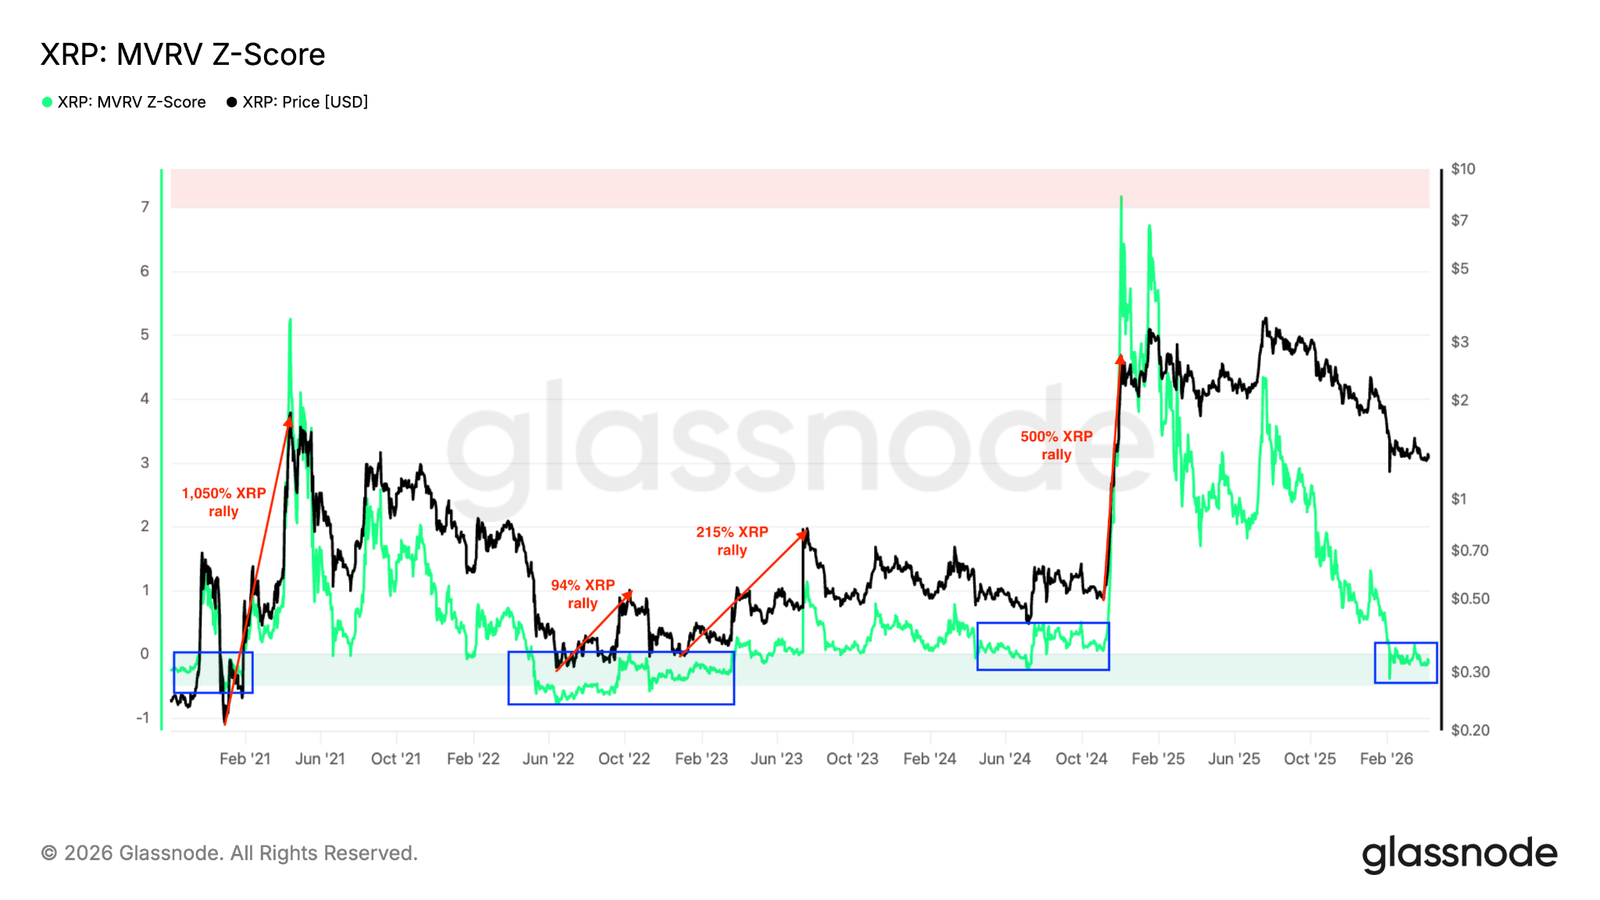
Note that the last time XRP’s MVRV Z-score fell to similar levels in late 2024 coincided with a macro market bottom at $0.30 and preceded a multi-month rally, with the XRP/USD pair rising 500% to a multi-year high above $3.
Meanwhile, the 0.80 MVRV pricing band, which has historically marked cycle bottoms, is currently at $1.14, coinciding with a 15-month low reached on Feb. 6.
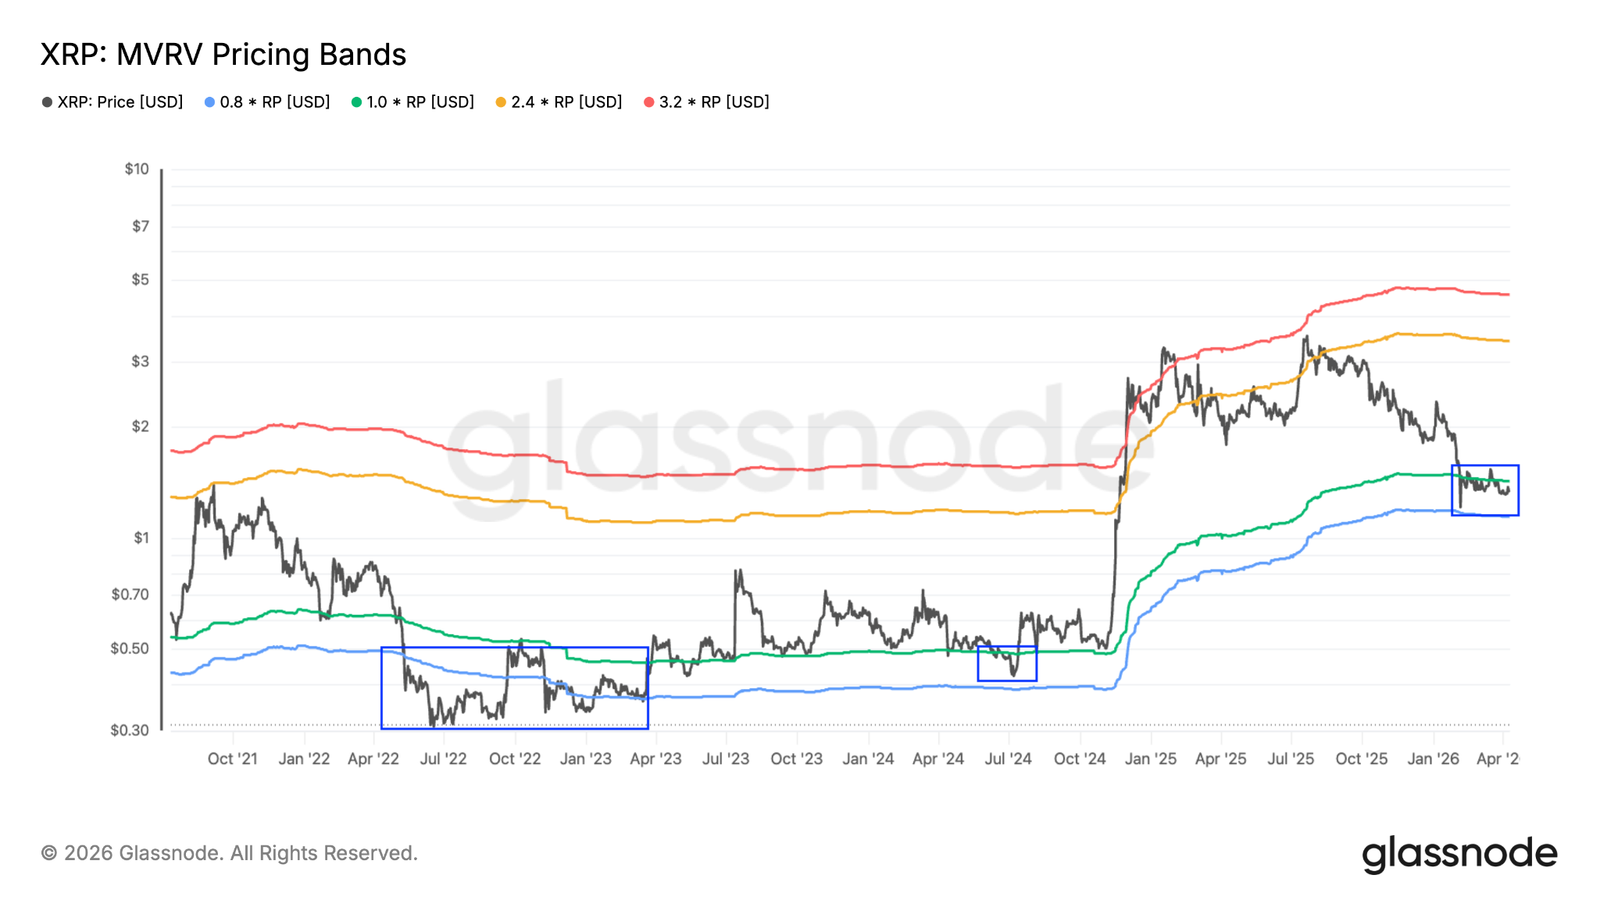
These onchain metrics suggest that XRP is undervalued and may continue the ongoing recovery, potentially rising toward $1.70 or higher.
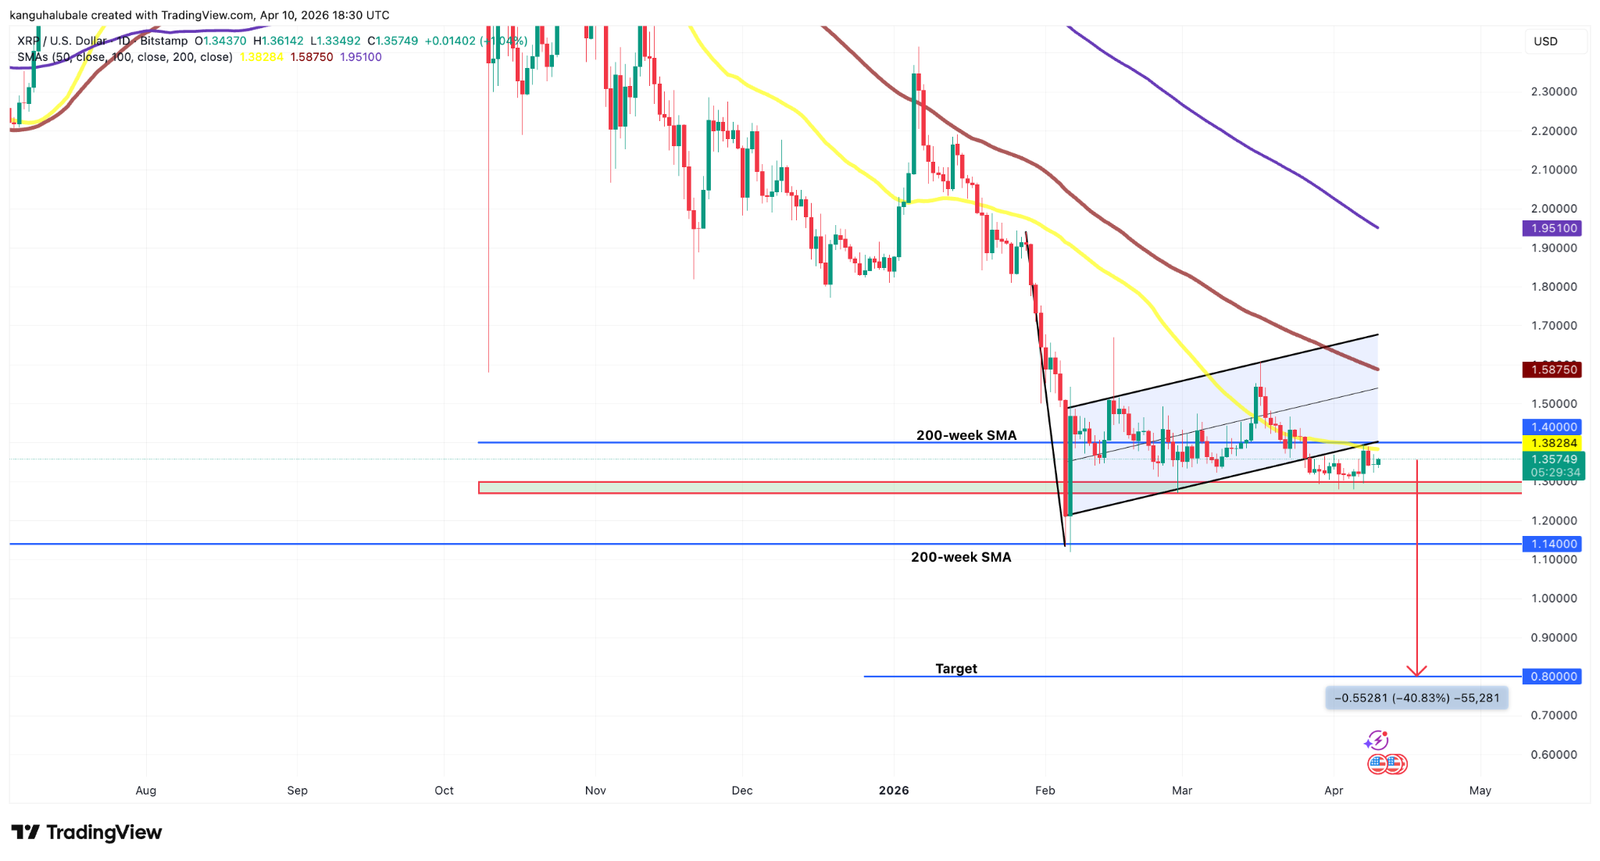
XRP price must hold above $1.30
Meanwhile, XRP/USD remains cautiously bullish as long as it holds the $1.25-$1.30 support zone.
“$XRP is sustaining the major support zone between $1.30-$1.25 levels since early Feb’26,” trader ChiefraT said in an X post on Friday, adding:
“If this zone continues to hold, then a short-term bounce towards $1.45 can’t be ruled out.”
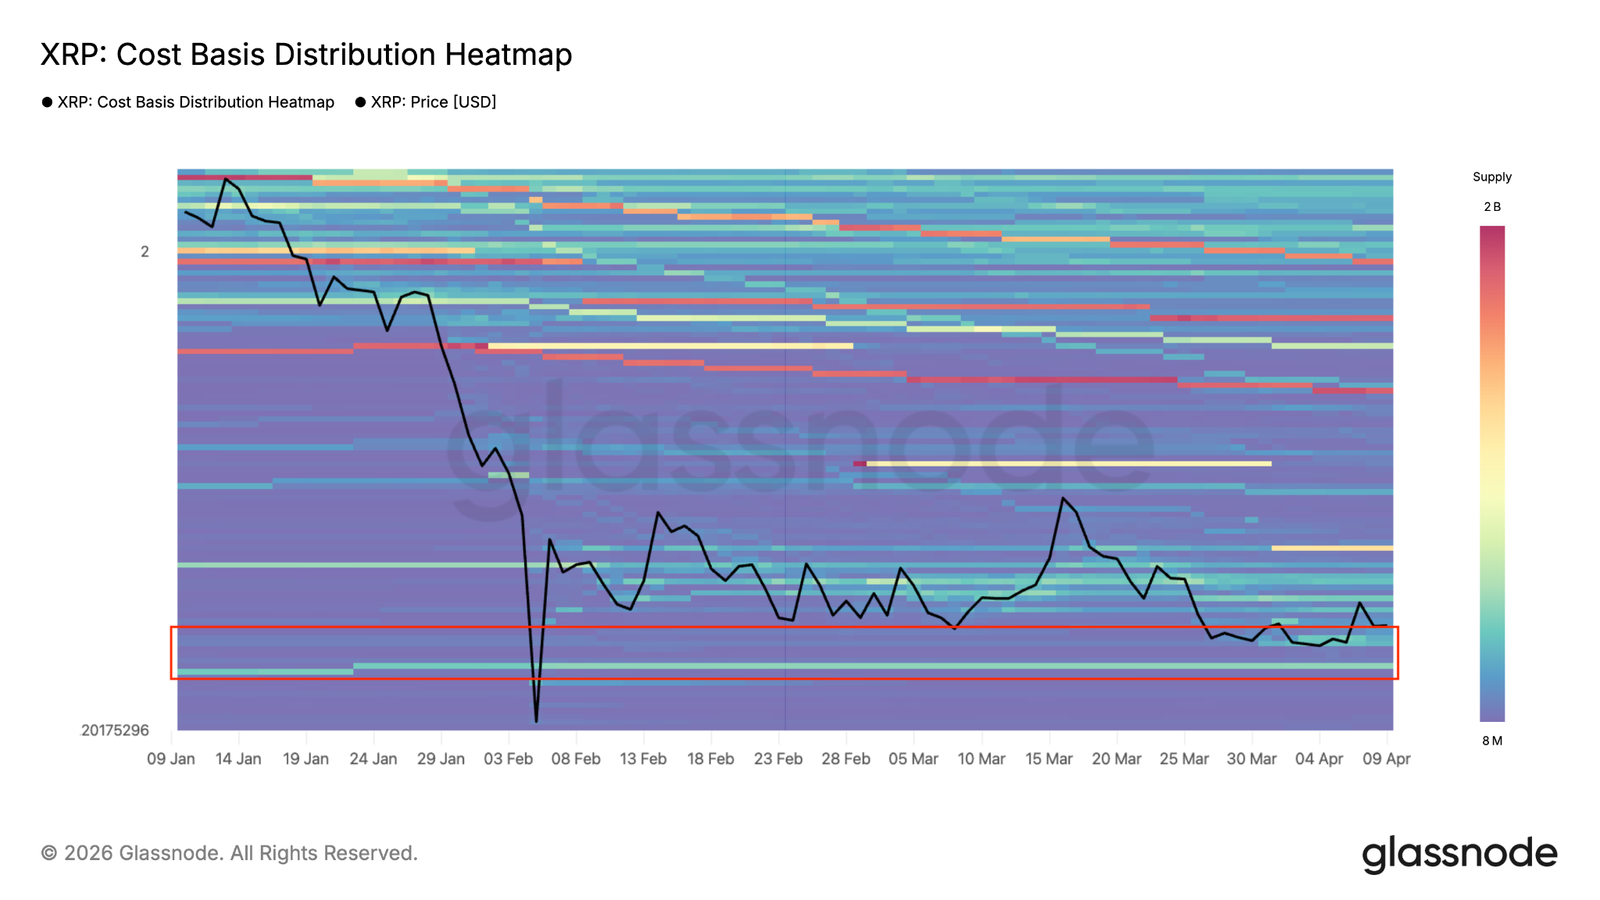
The importance of this support level is reinforced by cost basis distribution. The heatmap below shows that nearly 1.73 billion XRP were acquired around this price.
Below that, the next line of defence is the $1.15 demand zone, where the 200-week simple moving average is.
If XRP/USD drops below this level, it would be in a free-fall toward the measured target of the bear flag at $0.80, or 41% below the current price.
As Cointelegraph reported, holding $1.27-$1.30 would be a sign of strength among the bulls who must push the XRP/USD pair toward the $1.61 range high to regain control.
This article is produced in accordance with Cointelegraph’s Editorial Policy and is intended for informational purposes only. It does not constitute investment advice or recommendations. All investments and trades carry risk; readers are encouraged to conduct independent research before making any decisions. Cointelegraph makes no guarantees regarding the accuracy or completeness of the information presented, including forward-looking statements, and will not be liable for any loss or damage arising from reliance on this content.
Read the full article here
Fact Checker
Verify the accuracy of this article using AI-powered analysis and real-time sources.