


Listen to the article
Ether’s (ETH) recent sell-off was stopped at $1,800, as bulls aggressively defended the level. Ether’s rebound above $2,100, along with on-chain and technical data, suggests that traders will hold the price above $2,000 for the short-term.
Key takeaways:
-
Ether’s profitability metrics drop to levels that have historically marked local bottoms.
-
The MVRV Z-score and pricing bands suggest ETH price drop to $1,800 was the bottom.
-
ETH price bounced off a multi-year trendline that has marked previous macro lows.
Ether traders realize losses
Onchain data shows that Ether’s Spent Output Profit Ratio (SOPR) is at 0.96, suggesting ETH investors are still selling at a loss.
This metric dropped as low as 0.92 on Feb. 6, implying that Ether’s price drop to $1,800 was driven by traders realizing losses amid panic and extreme fear.
Related: Ethereum stablecoin supply hits $180B all-time high: Token Terminal
SOPR measures the profit or loss of spent ETH outputs by comparing the value of coins when they were last moved to their value when they are spent again.
A value below 1 might suggest capitulation or a market bottom, potentially signaling a good time to buy.
Historically, this scenario has often preceded price recoveries. When SOPR fell to 0.86 following Ether’s drop to $1,500 in April, it was followed by a 246% price recovery to its current all-time high of $4,950.
Similar scenarios in 2022 and 2023 were followed by 130% and $155% ETH price rallies, respectively.
As such, some investors saw the drop to $3,000 as an opportunity to buy.
MVRV Z-Score suggests Ether bottomed at $1,800
Ether’s MVRV Z-Score, a key onchain metric used to identify market tops and bottoms, has dropped into the historical accumulation zone (the green line in the chart below), strengthening the argument that ETH may have found a bottom.
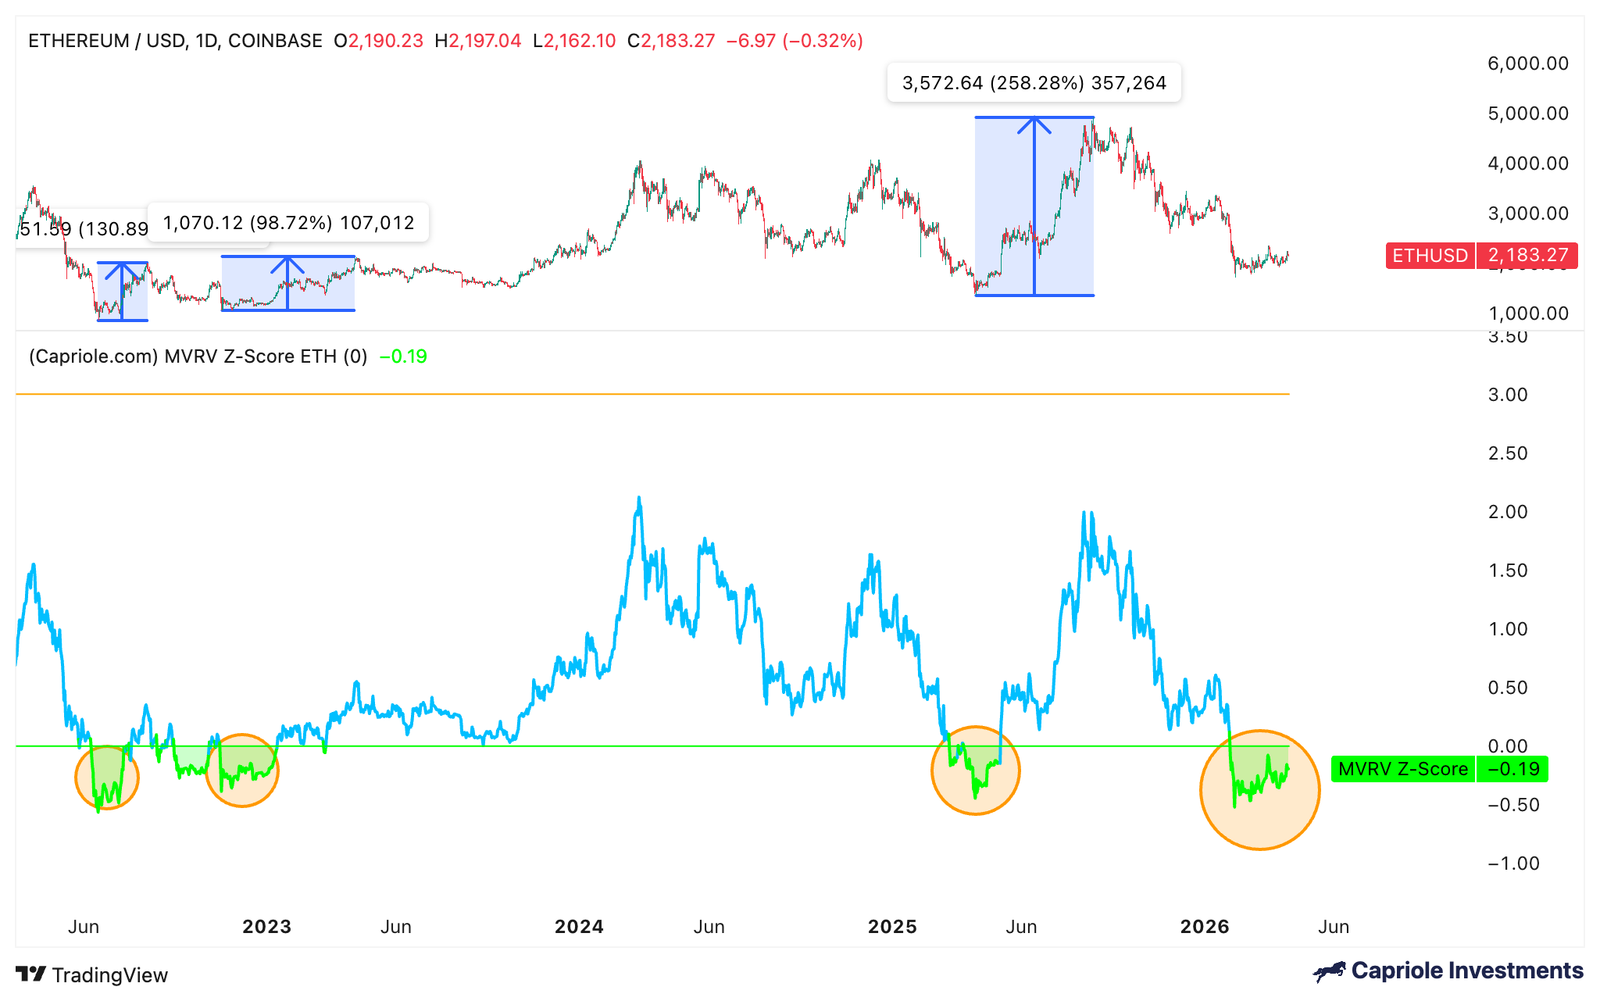
The last time Ether’s MVRV Z-score fell to the current levels was in April 2025, after a 66% price drawdown. This coincided with a macro market bottom at $1,400 and preceded a multi-month rally, with the ETH/USD pair rising 258% to its current all-time high of $4,950.
Meanwhile, the 0.80 MVRV pricing band, which has historically marked cycle bottoms, is currently at $1,880.
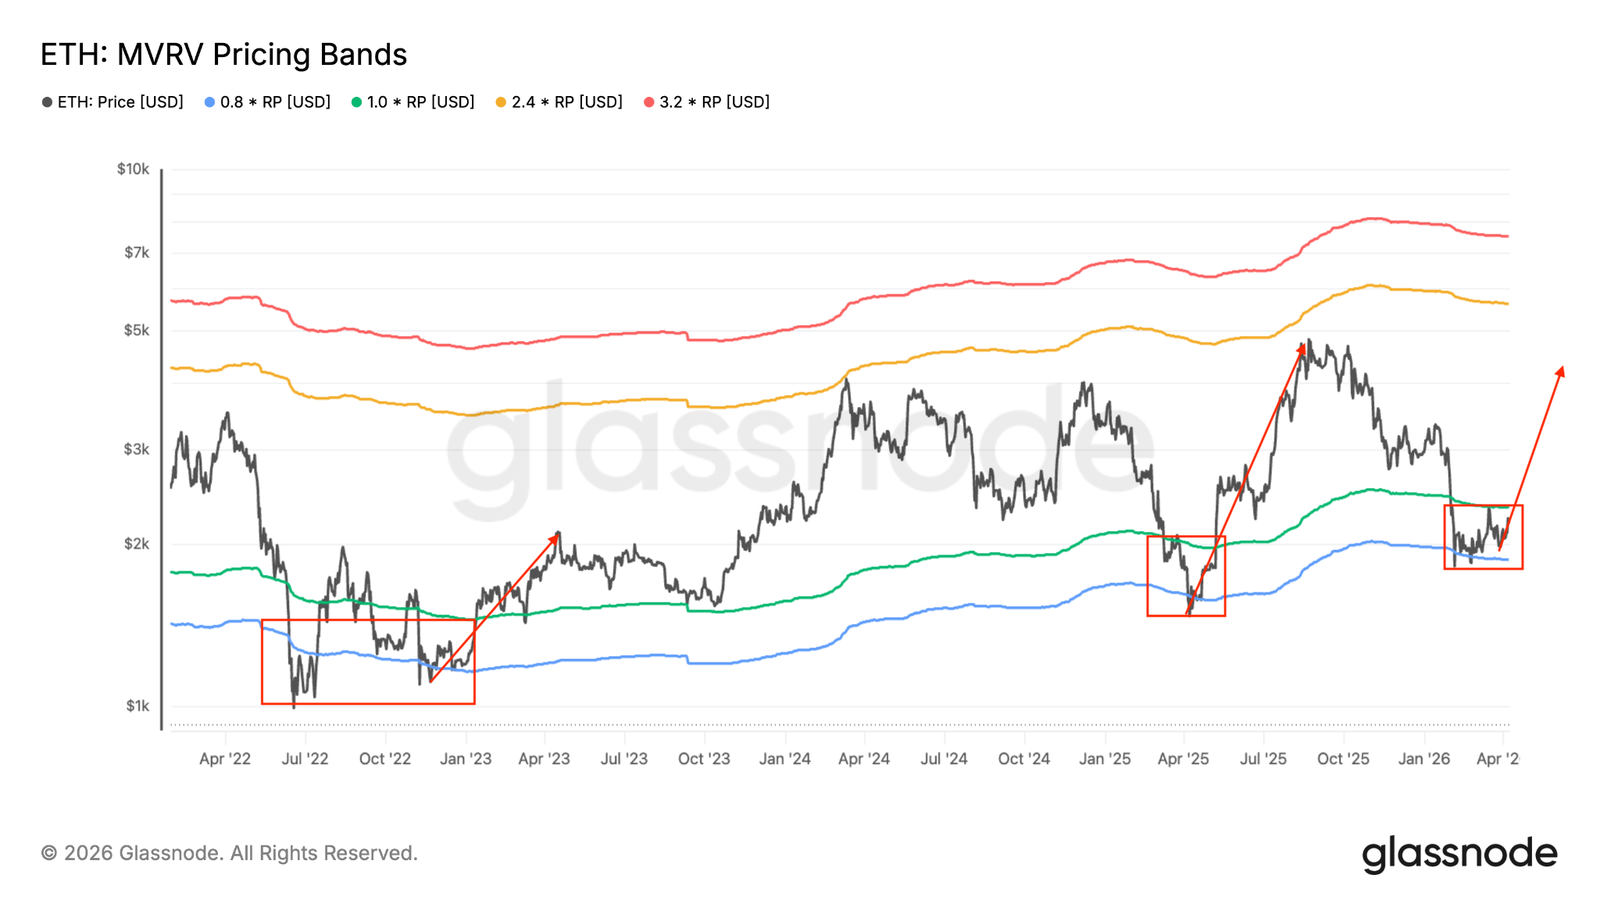
This indicates that, from an onchain perspective, Ether is undervalued and may continue the ongoing recovery, potentially rising toward dense liquidity clusters between $2,400 and $2,600 in the short term.
ETH price sits on strong support above $1,800
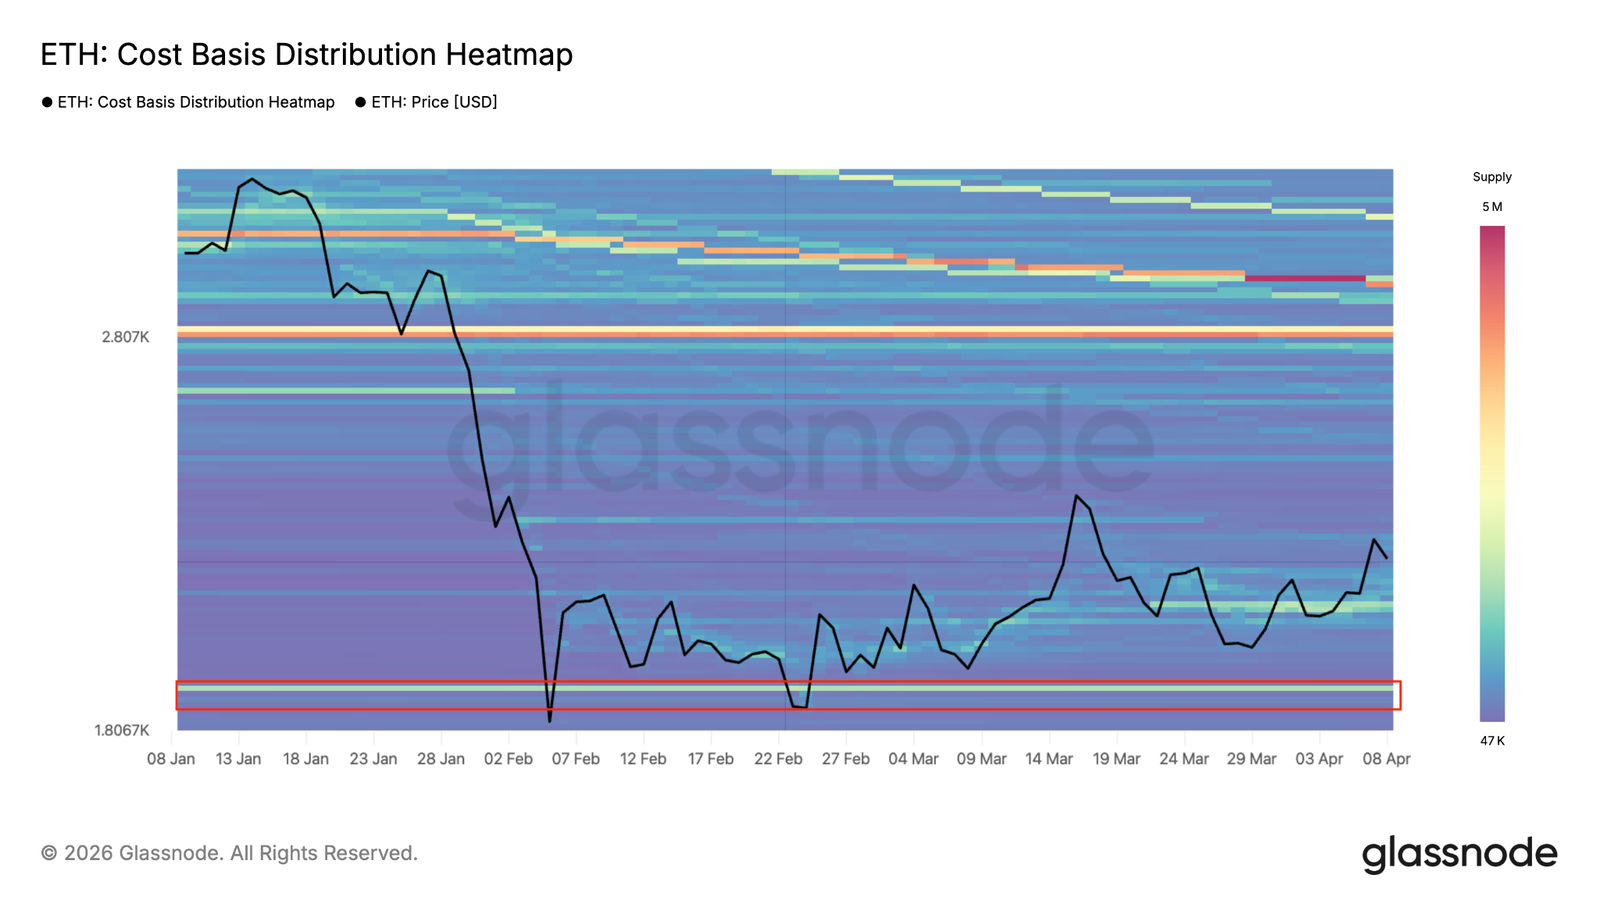
Data from TradingView shows that ETH price has successfully held above a key support zone over the last two months, as illustrated in the chart below.
This is the area around $1,800, where investors acquired more than 1.35 million ETH, according to Glassnode’s cost basis distribution heatmap.
This level aligns with a multi-year trendline that has historically marked the bottom for ETH/USD, as seen in 2022 and in April 2025.
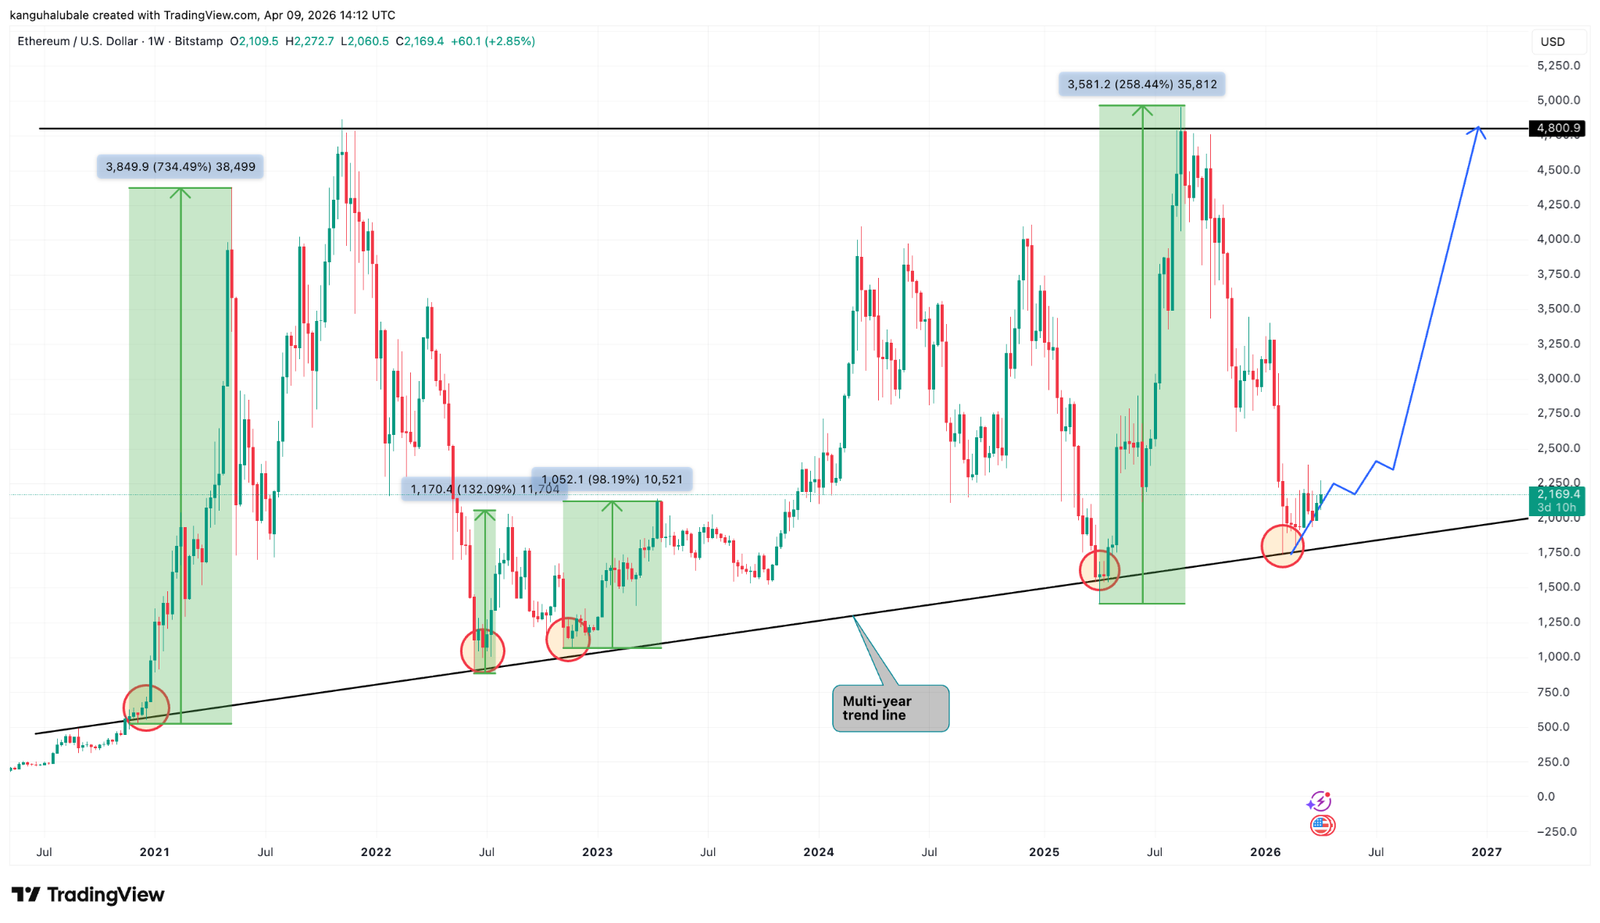
Ether’s rebound from this level in early February suggests the trendline still holds as support, paving the way for a sustained recovery toward $4,800.
As Cointelegraph reported, a drop below $2,000, where the 20-day EMA and the 50-day SMA converge, could see the price drop toward the next major support at $1,750.
This article is produced in accordance with Cointelegraph’s Editorial Policy and is intended for informational purposes only. It does not constitute investment advice or recommendations. All investments and trades carry risk; readers are encouraged to conduct independent research before making any decisions. Cointelegraph makes no guarantees regarding the accuracy or completeness of the information presented, including forward-looking statements, and will not be liable for any loss or damage arising from reliance on this content.
Read the full article here
Fact Checker
Verify the accuracy of this article using AI-powered analysis and real-time sources.