


Listen to the article
Bitcoin (BTC) is copying the end of its 2022 bear market “nearly perfectly,” according to a new BTC price analysis.
Key points:
-
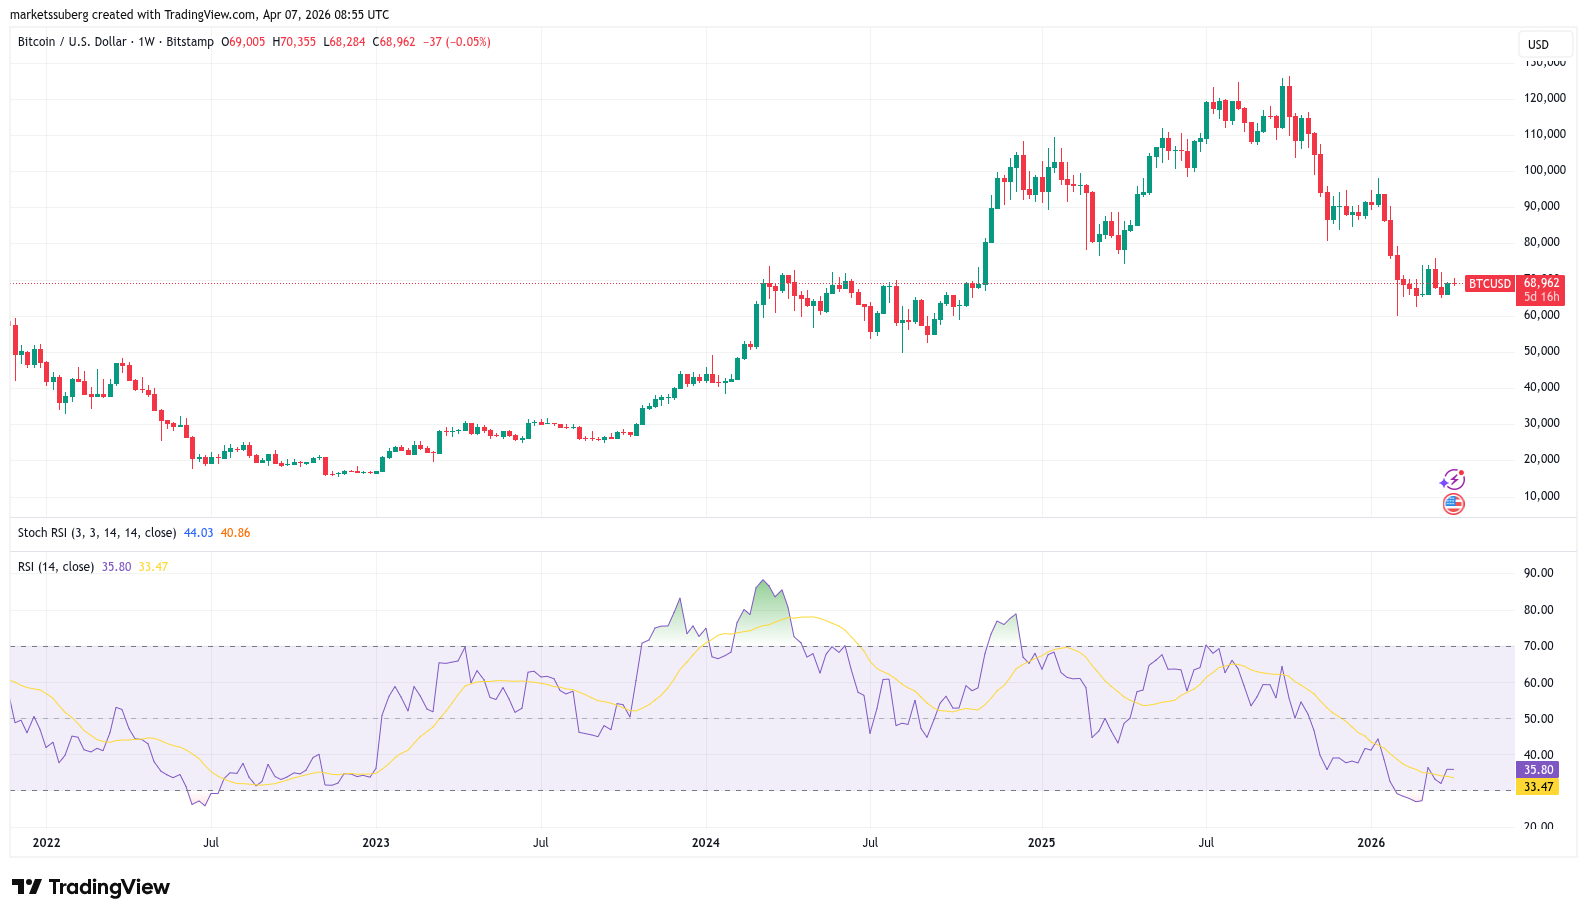
Bitcoin stochastic RSI values are “nearly perfectly” repeating the end of its last bear market, new analysis claims.
-
Both recent local bottoms and the current rebound echo conditions from three years ago.
-
Standard RSI is already on the radar for a potential BTC price bottom signal.
Bitcoin stochastic RSI echoes 2023 rebound
In an X post on Monday, crypto trader Quantum Ascend revealed copycat moves playing out on Bitcoin’s stochastic relative strength index (RSI) indicator.
Stochastic RSI, also known as “stoch RSI,” is a derivative of traditional RSI — a classic leading indicator that helps traders identify overbought and oversold conditions, as well as BTC price trend changes.
Like its standard counterpart, stoch RSI flashes “oversold” price signals when it drops below 30/100 on its scale, with “overbought” entering when its value is above 70/100.
Stoch RSI moves between those two zones much more quickly, but Quantum Ascend sees a key long-term bull signal now locking in.
“RSI at the EXACT SAME point on the Daily as it was in 2022,” he told X followers.
An accompanying comparative chart shows stoch RSI making a double bottom along with price before both surged higher in early 2023. At the time, BTC/USD had recently set a multiyear low of $15,600 — a level that ended up forming the bear-market bottom.
Now, Quantum Ascend says, the repeat performance is “playing out nearly perfectly.”
“Breaking above the EXACT SAME level (blue line). At the EXACT SAME time,” he added.
The chart reveals that stoch RSI is now attempting to clear its 50/100 midpoint after two local lows in late January and late March, respectively.
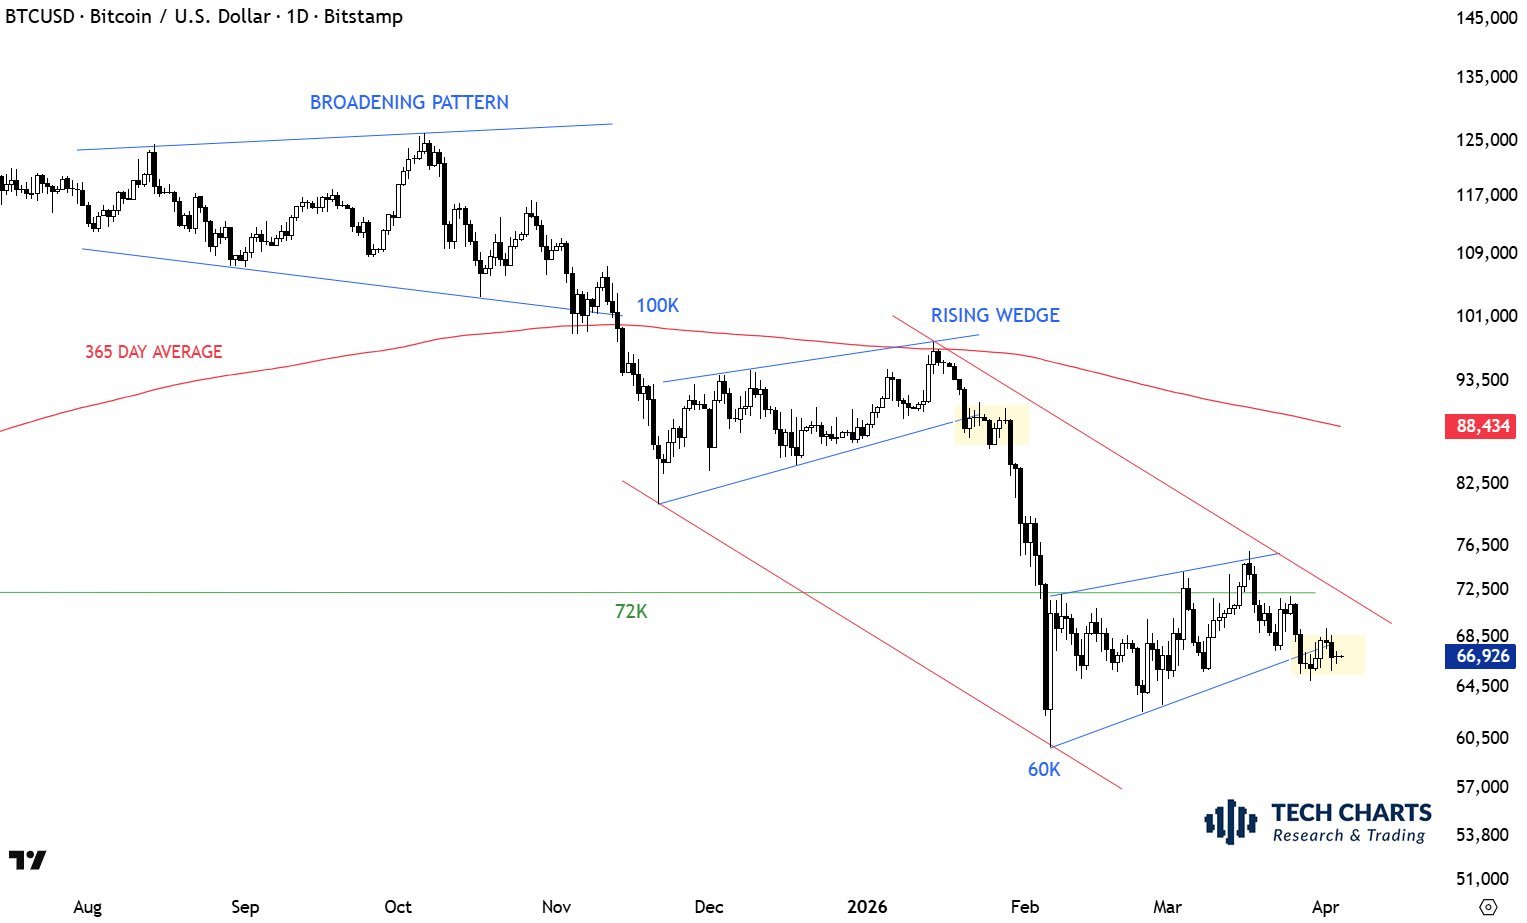
BTC price counts down to bear flag decision
RSI signals have already been firing in 2026 despite lackluster BTC price strength.
Related: First real bull signal since 2025? Five things to know in Bitcoin this week
As Cointelegraph reported, eyes are on weekly standard RSI to print a bullish divergence with price, again mimicking early 2023.
I stuck to my plan religiously in the bull, and I will do the same in the bear.
As such, it’s time to start paying attention – as it looks like $BTC is forming a potential higher low on the weekly RSI.
Giving it a few more weeks to develop, given how the previous bottoms had… pic.twitter.com/nnT84R5Til
— Jelle (@CryptoJelleNL) April 7, 2026
At the time, weekly RSI set its lowest level on record — one so far not matched in 2026, per data from TradingView.
Bitcoin still faces bearish hurdles to recovery, with traders concerned about a bear-flag breakdown repeating on the daily chart.
“In a few days we will understand if the pattern is repeating or not,” analyst Aksel Kibar wrote on X over the weekend.
This article is produced in accordance with Cointelegraph’s Editorial Policy and is intended for informational purposes only. It does not constitute investment advice or recommendations. All investments and trades carry risk; readers are encouraged to conduct independent research before making any decisions. Cointelegraph makes no guarantees regarding the accuracy or completeness of the information presented, including forward-looking statements, and will not be liable for any loss or damage arising from reliance on this content.
Read the full article here
Fact Checker
Verify the accuracy of this article using AI-powered analysis and real-time sources.