


Listen to the article
Bitcoin’s (BTC) recent recovery above $71,000 suggests that the price bottom is officially in, and bullish momentum can be seen across the crypto market. TOTAL2, which tracks the market cap of all crypto assets excluding Bitcoin, has held support at its 200-week moving average, but is an altcoin season in the making?
The divergence between Bitcoin’s rally and the muted altcoin price action is beginning to draw attention to altseason indicators, raising the question of whether the broader market may soon follow BTC’s lead.
TOTAL2 tests long-term support just below $1 trillion
The TOTAL2 market cap peaked near $1.7 trillion in October 2025 but currently sits at $970 billion, a drawdown of roughly 43%. The decline accelerated in January after the market cap broke a three-year ascending trendline near $1.15 trillion.
Market attention has now shifted to the higher-timeframe support. On the weekly chart, the TOTAL2 market cap trades close to its 200-week moving average near $900 billion, a level that held during market corrections in September 2024 and April 2025.
The daily chart shows consolidation beneath the former trendline and the $1.1 trillion to $1.25 trillion resistance band, a zone that previously held large liquidity clusters.
The altcoin positioning metrics align with the drop in TOTAL2. CryptoQuant data highlighted that 36.8% of altcoins are trading near their historical lows, excluding Bitcoin, Ether (ETH), and stablecoins.

These elevated readings appear when capital concentrates in larger assets. XWIN Research said that spot Bitcoin ETF inflows and the growing number of tokens have intensified competition for liquidity across smaller assets over the past year.
Related: Hyperliquid’s HYPE price will hit $150 by August, predicts Arthur Hayes
Average altcoin performances near cycle lows
Data from CryptoQuant outlined how deeply altcoins have underperformed Bitcoin. The average altcoin trades 44.4% below its 200-day simple moving average (SMA), a level historically seen near bear-phase bottoms.
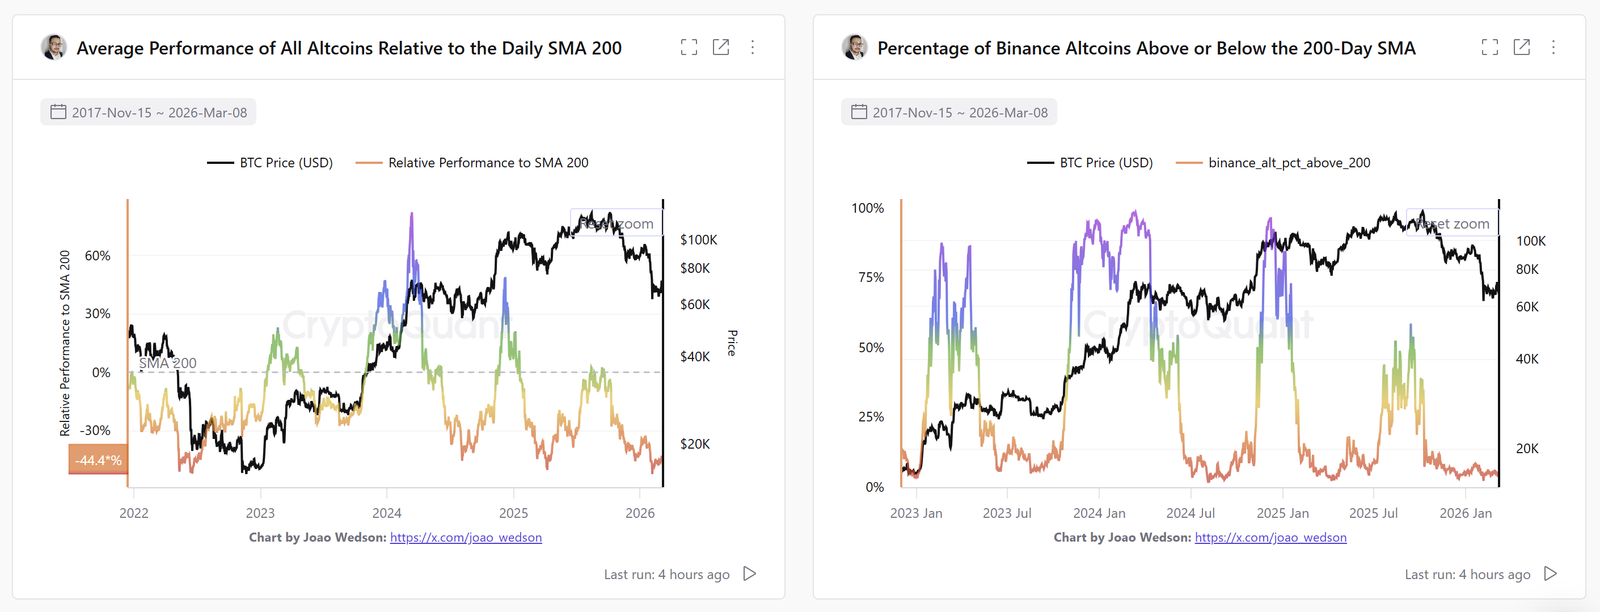
The exchange data shows similar weakness. Only 4.59% of Binance-listed altcoins trade above their 200-day SMA, confirming a strong Bitcoin-led phase.
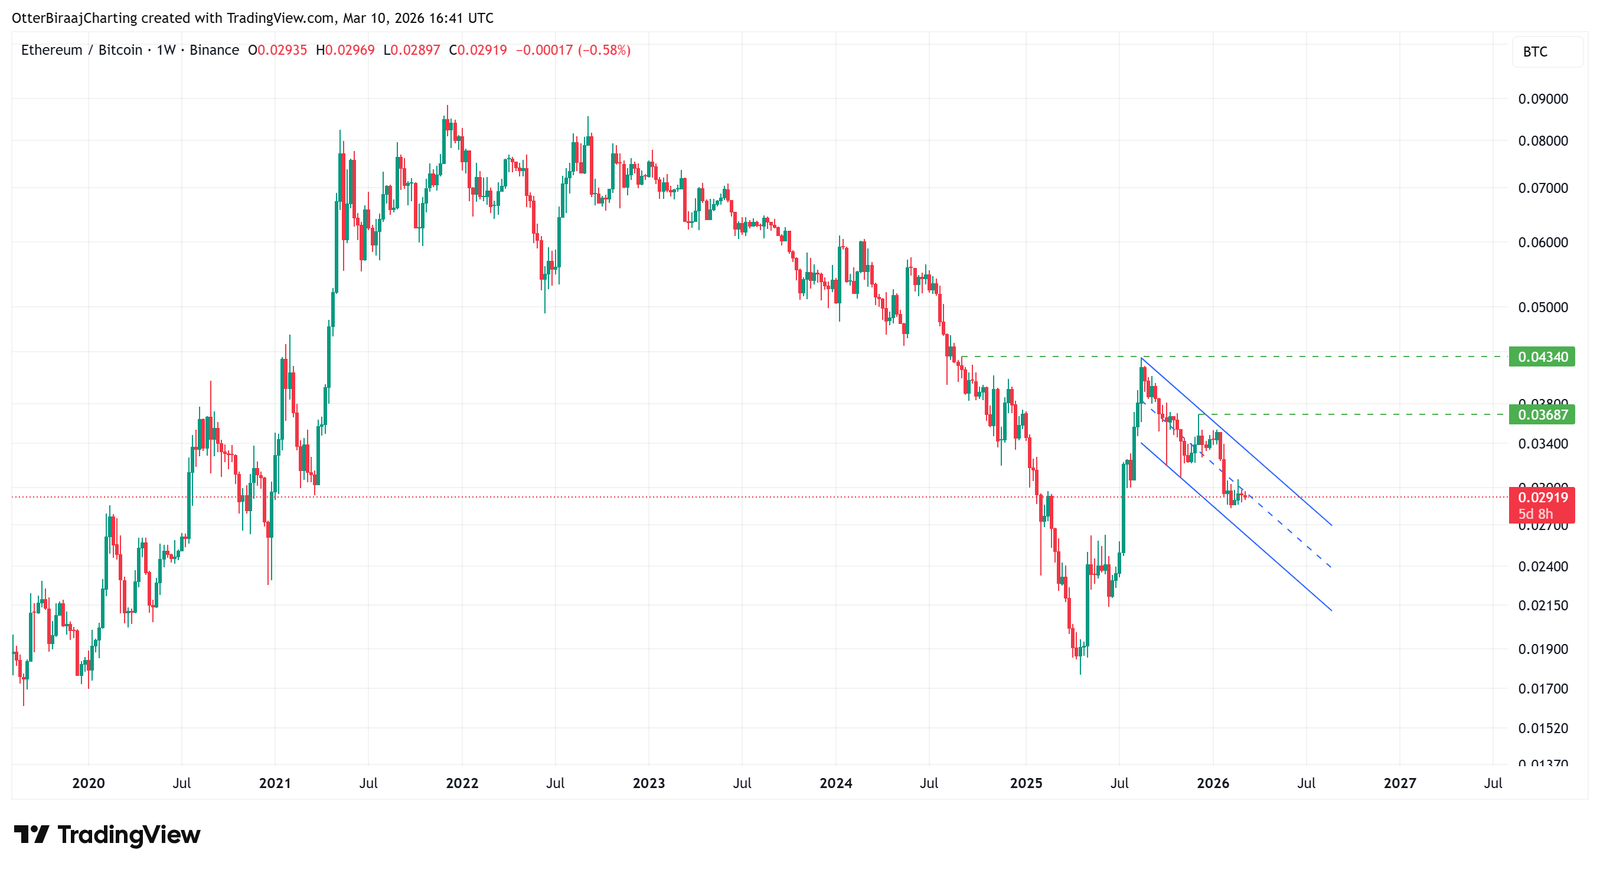
The altcoin expansion typically begins with Ether’s (ETH) leadership. The ETH/BTC pair has not established an uptrend and continues to trade inside a descending channel on the weekly chart.
A move above 0.036 may mark the first break of the channel’s local resistance and signal improving relative strength for ETH. A stronger shift in capital rotation could emerge if the pair reclaims 0.043, a level that previously acted as resistance before the broader decline in 2025.
Until these levels are reclaimed, Bitcoin-led momentum continues to dominate the recovering crypto market.
Market analysts are also debating whether the next altcoin cycle will resemble past rallies. Bitwise Chief Investment Officer Matt Hougan recently said that future altcoin seasons may not lift the entire market equally, arguing that the capital will most likely be concentrated in projects with stronger adoption and real-world applications.
Related: Bitcoin vs gold: ETF flows point to early capital rotation signs
This article does not contain investment advice or recommendations. Every investment and trading move involves risk, and readers should conduct their own research when making a decision. While we strive to provide accurate and timely information, Cointelegraph does not guarantee the accuracy, completeness, or reliability of any information in this article. This article may contain forward-looking statements that are subject to risks and uncertainties. Cointelegraph will not be liable for any loss or damage arising from your reliance on this information.
Read the full article here
Fact Checker
Verify the accuracy of this article using AI-powered analysis and real-time sources.