


Listen to the article
Bitcoin (BTC) slid to a weekly low of $64,111 during the New York trading session on Monday, taking out the range lows that were initially set on Sunday evening. Despite the weakness, the price action continues to rotate closely within the three-week range between $65,000 and $71,000.
Derivatives data outlines a clear lack of bearish follow-through for a deeper correction, while the liquidity positioning may frame the next move on the opposite side of the current trading range.
Bitcoin traders may target the upside liquidity next
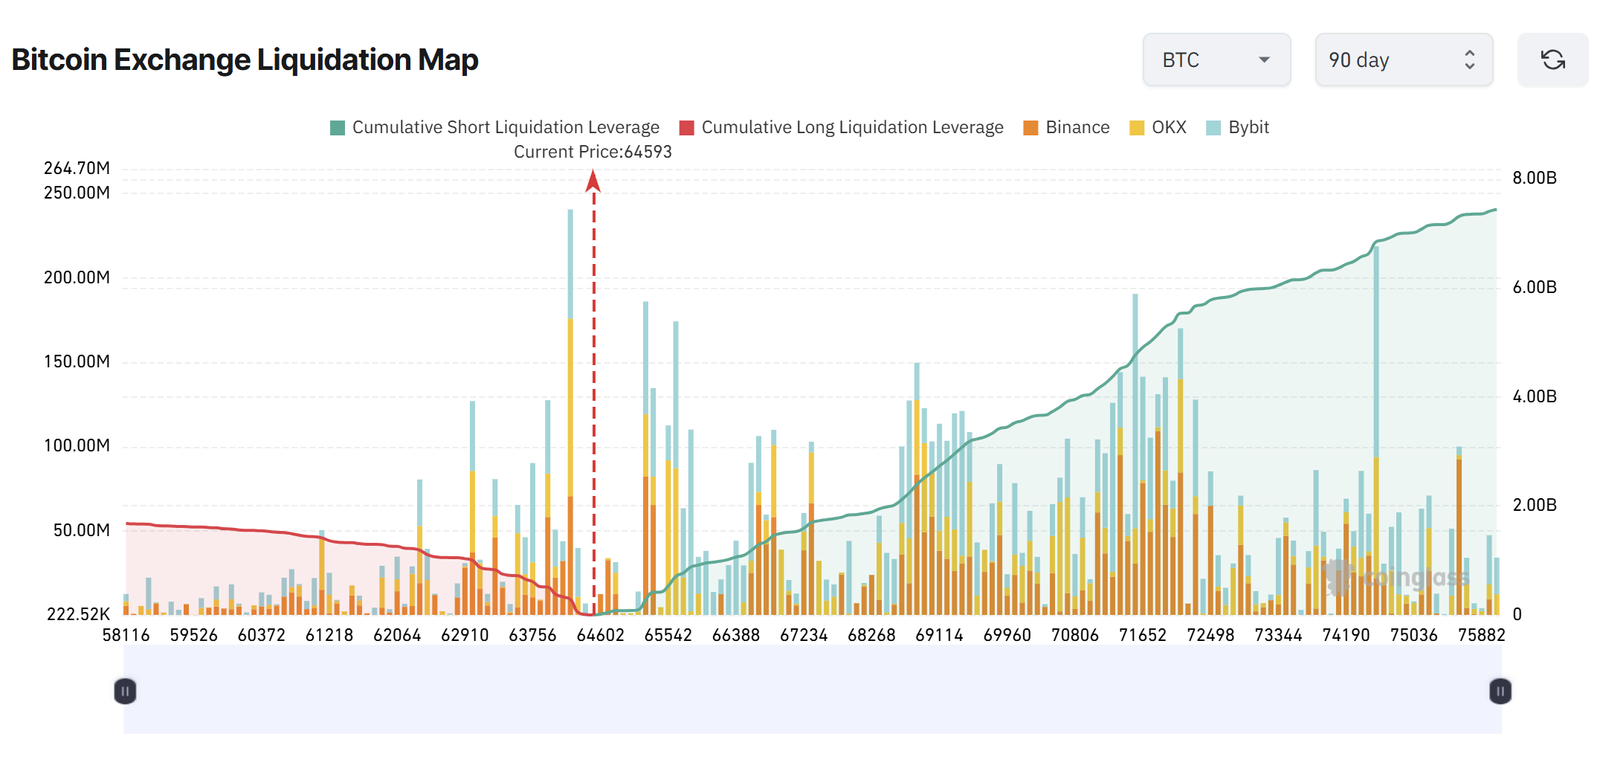
The recent price drop swept liquidity around $64,000 and liquidated roughly $240 million in long positions. Despite the sell-off, Bitcoin has remained within the established range that has been in place since Feb. 6. A sideways trend often builds pressure for an expansion, especially as the volatility compresses.
The Bollinger Bands have tightened, signaling reduced volatility and the potential for an expansive move.
The liquidity data shows a clear asymmetry. Roughly $1 billion in long positions face liquidation if the price tags $63,000. In contrast, more than $3.5 billion in short positions are vulnerable near a $70,000 retest. This creates a visible liquidity magnet on both ends of the range, though the concentration is notably denser on the upside.
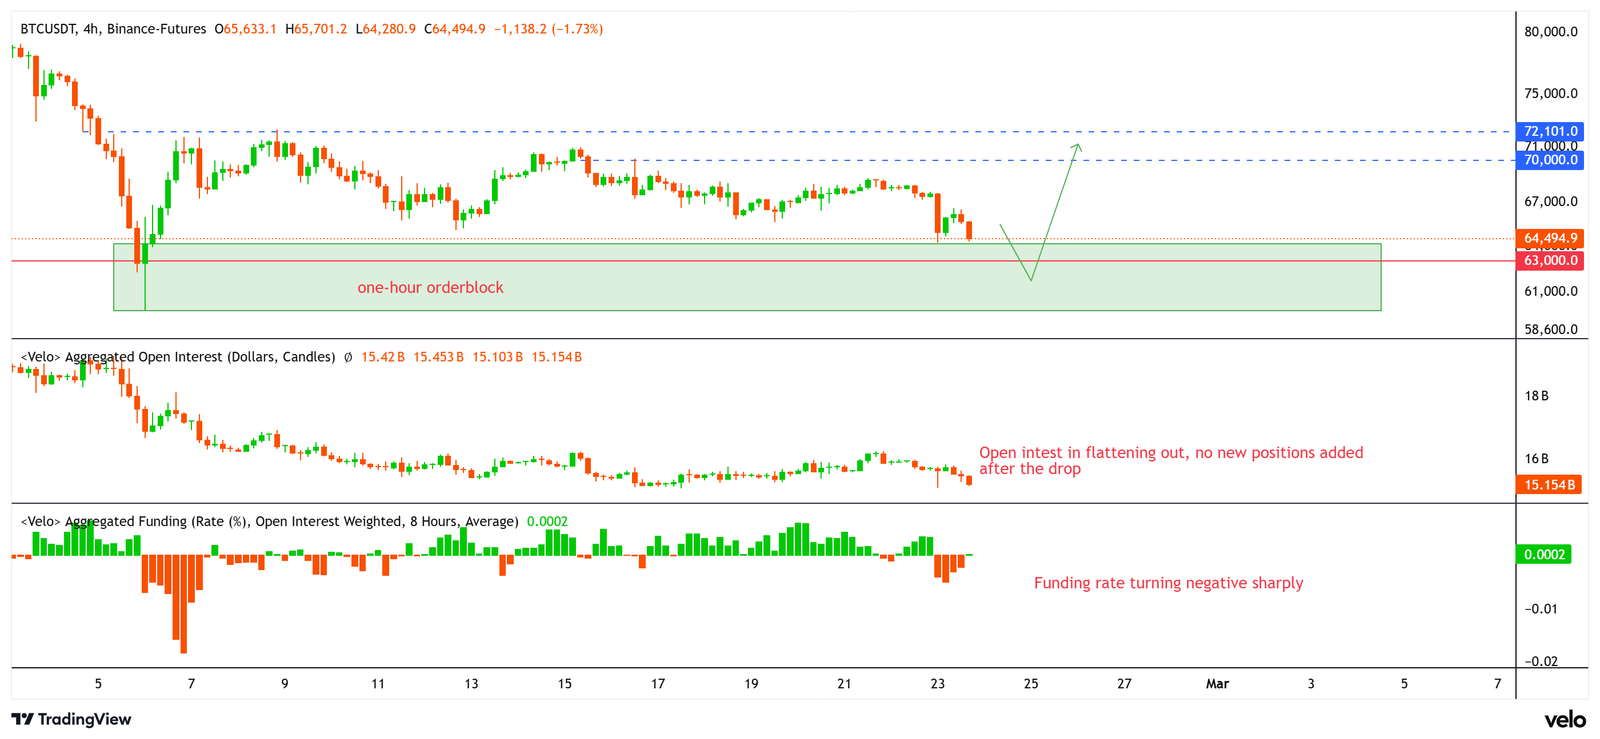
Bitcoin open interest, which tracks the total value of outstanding futures contracts, has flattened near the local lows. Traders are not aggressively adding new exposure after the drop, possibly sidelined at the moment.
The funding rates have turned negative on the four-hour chart, meaning that the short sellers are paying the longs. This shift indicates that the positioning has tilted defensively while the price continues to hold the range support, opening the possibility of a short squeeze if the upside liquidity is targeted.
Trader Lennaert Snyder noted that Bitcoin “finally grabbed the $64,500 liquidity,” adding that reclaiming the $67,751 high may open the door toward $76,971, with partial profit targets along the way. A rejection near that level invites short-term downside toward the range lows.
Related: Bitcoin treasuries log rare selling streak as BTC trades near $66K
BTC may tag $63,000 before recovery
The one-hour chart highlights the order block around $63,000, a zone where the large buyers previously stepped in. The order blocks mark areas of concentrated activity and can act as an inflection point on retests.
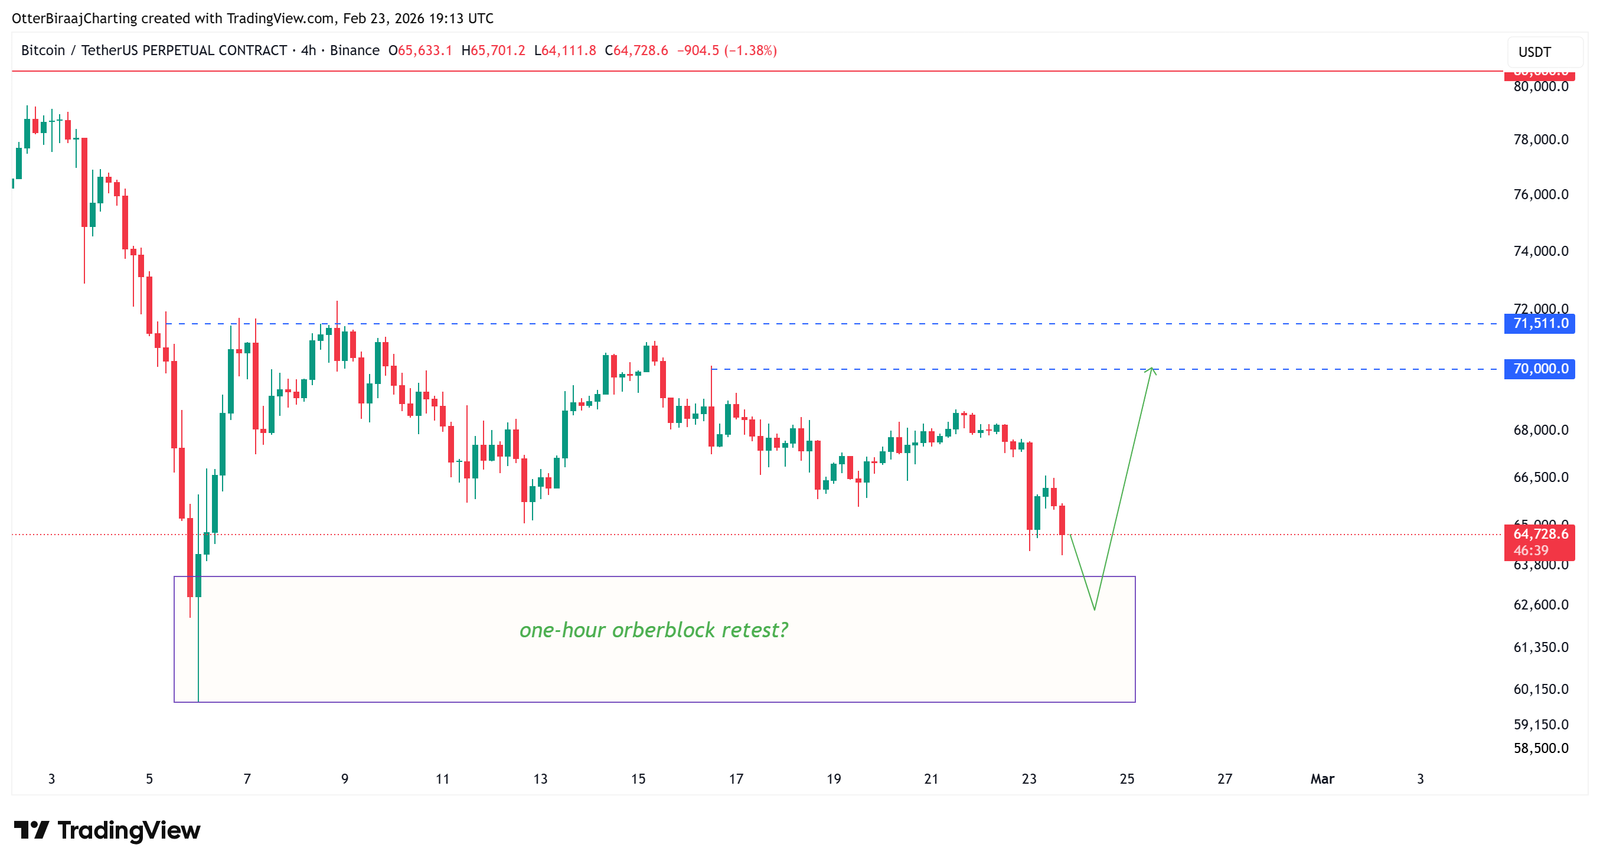
A brief sweep into the $63,000 region clears the remaining long liquidity and tests that demand zone. If the buyers defend it, the price may rotate back toward the mid-range and potentially the $70,000 resistance cluster.
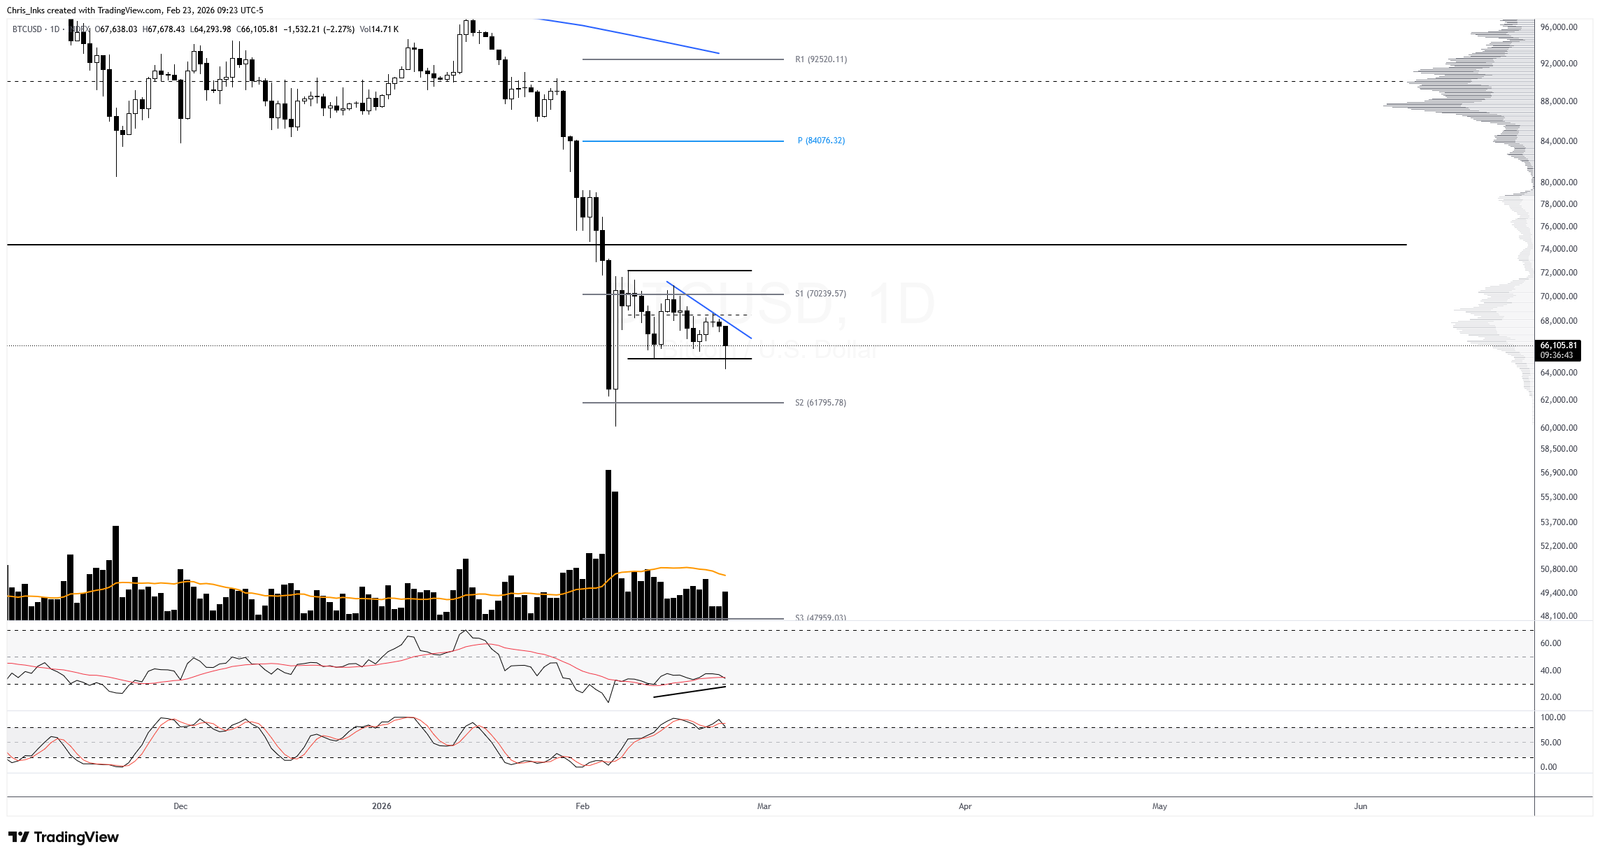
Meanwhile, TexasWest Capital founder Christopher Inks pointed to the developing bullish relative strength index (RSI) divergence on the daily chart, alongside the rising volume and a wick below the range support.
A positive daily close above the reclaimed level may strengthen the case for another attempt at the range highs.
Related: Bitcoin traders diverge over BTC price strength with $60K in sight
This article does not contain investment advice or recommendations. Every investment and trading move involves risk, and readers should conduct their own research when making a decision. While we strive to provide accurate and timely information, Cointelegraph does not guarantee the accuracy, completeness, or reliability of any information in this article. This article may contain forward-looking statements that are subject to risks and uncertainties. Cointelegraph will not be liable for any loss or damage arising from your reliance on this information.
Read the full article here
Fact Checker
Verify the accuracy of this article using AI-powered analysis and real-time sources.